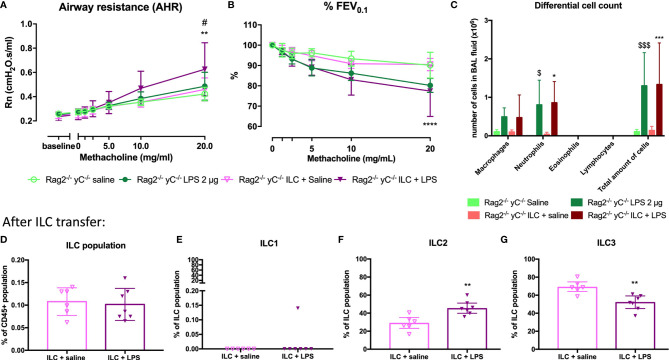
Figure 7.
Effect of adoptive transfer of ILC in Rag2-/- γC-/- mice. ILC cells were isolated by sorting from lung tissue of SCID mice and intravenously injected (104 cells) in Rag2-/- γC-/- mice. Twenty-four hours after the adoptive transfer, Rag2-/- γC-/- mice were endonasally exposed to LPS (2 µg in 50 µl saline) on four consecutive days. Twenty-four hours after the last LPS challenge, lung function parameters were measured using the FlexiVent, and BAL fluid was obtained for differential cell count and lung tissue for ILC identification. Airway resistance [Rn, (A)] and FEV0.1 [%, (B)] before and after methacholine provocation (0–20 mg/ml) were measured in saline-treated Rag2-/- γC-/- mice (n = 5), LPS-treated Rag2-/- γC-/- mice (n = 6), saline-treated Rag2-/- γC-/- mice after ILC transfer (n = 6), and LPS-treated Rag2-/- γC-/- mice after ILC transfer (n = 6). Data are represented as mean with standard deviation. Two-way ANOVA was used to determine significant differences. Differential cell count in BAL fluid of the same mice is shown in (C). Total ILC population (D), ILC1 (E), ILC2 (F), ILC3 (G) were identified in lung tissue via flow cytometry in saline-treated Rag2-/- γC-/- mice with ILC transfer (n = 6) and LPS-treated Rag2-/- γC-/- mice with ILC transfer (n = 6). These data are represented as individual values with median and interquartile range. Results from three independent experiments were combined. The unpaired t-test (D, F, G) or Mann–Whitney test (E) were used to calculate the p-value. *p < 0.05; **p < 0.01; ****p < 0.0001 (ILC + saline versus ILC + LPS). #p < 0.05 (LPS versus ILC + LPS); $p < 0.05; $$$p < 0.001 (saline versus LPS).

