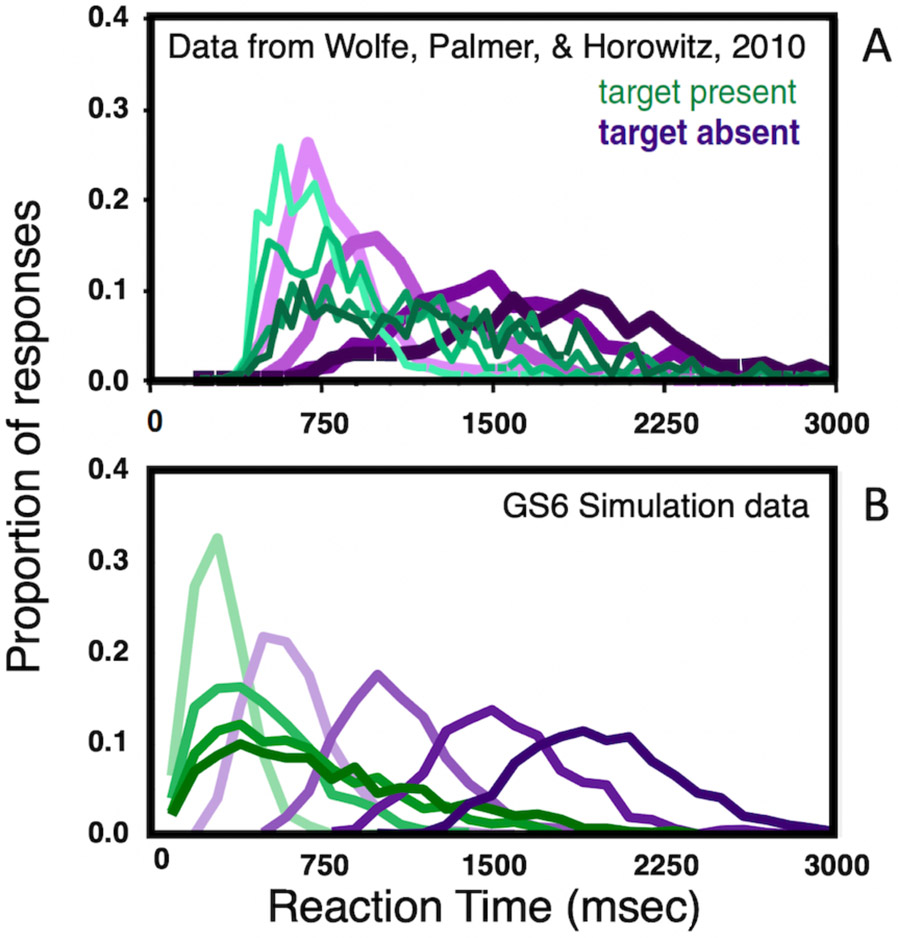
Figure 11:
RT distributions: A) Data from Wolfe, Palmer, & Horowitz (2010). B) GS6 simulation data. Each distribution represents one set size. Lighter curves are smaller set sizes (the four set sizes are 5, 10, 15, & 20, prevalence is 0.5). Green shows target-present. Purple shows target-absent.

