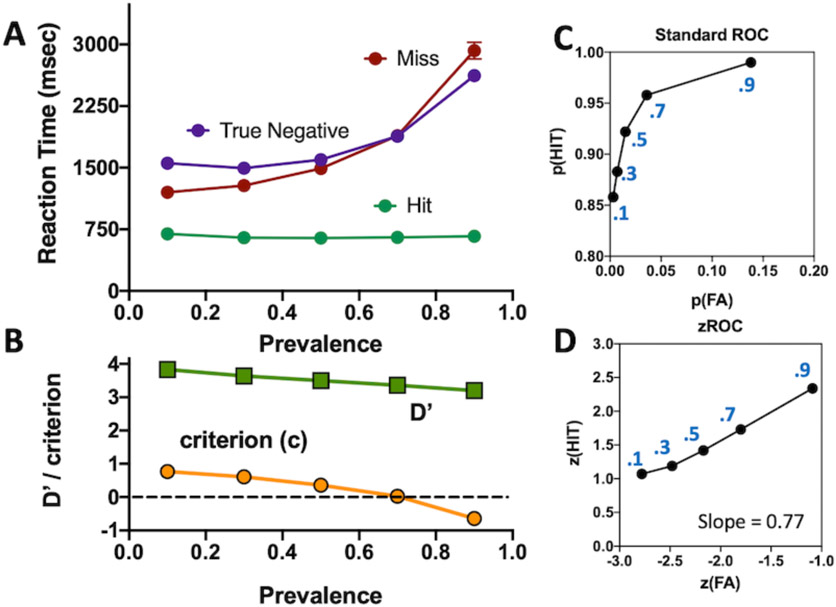
Figure 12:
Simulation of prevalence effects. A) RT as a function of prevalence, B) D’ and criterion, ’c’ as function of prevalence, C) ROC derived from variation in prevalence. Blue number values within the graph show prevalence associated with each datapoint. D) zROC derived from variation in prevalence. See the supplement to Wolfe & VanWert (2010) for comparison data.

