
Figure 2. Reprogramming IT-Type PNs Disrupts the Lamination of CGE-but Not MGE-Derived INs.
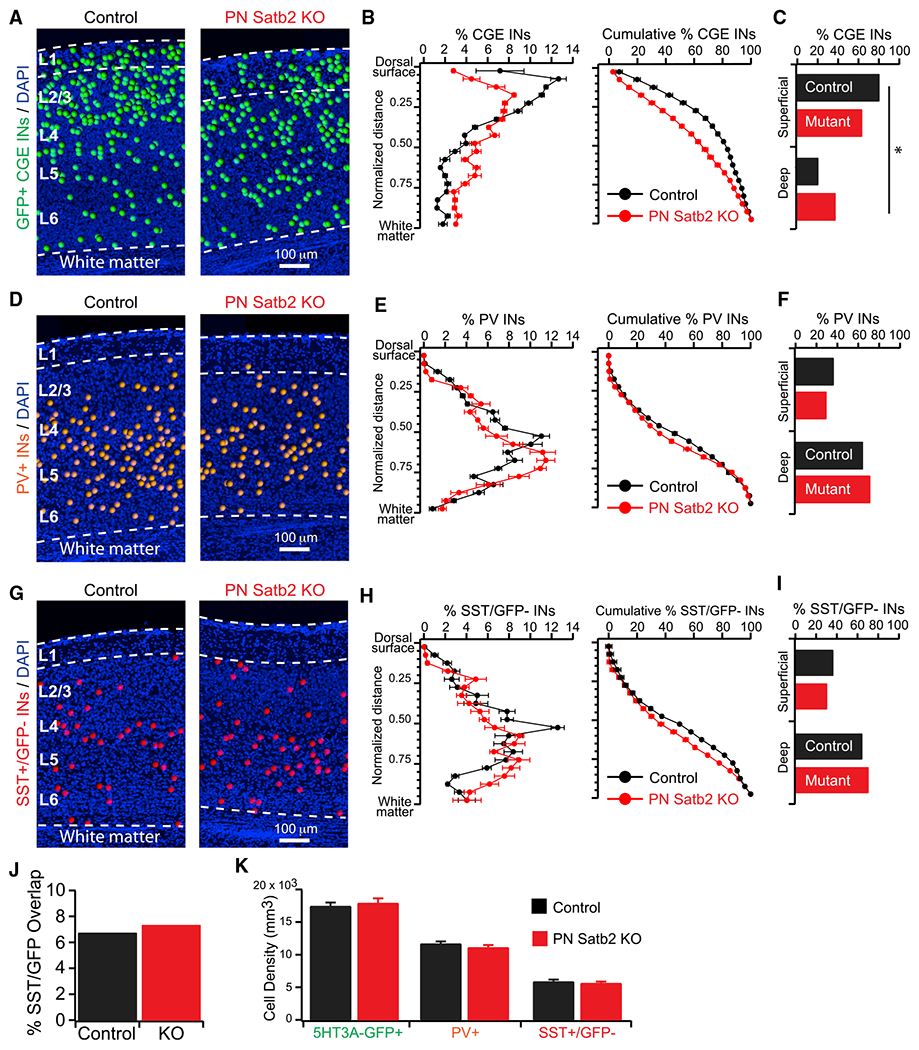
(A) CGE IN cell body positions.
(B) (Left) Percentage of CGE INs as a function of normalized cortical depth. (Right) Cumulative percentage.
(C) Total percentage of CGE INs in the top 50% (first 10 bins: Superficial) versus bottom 50% (last 10 bins: Deep) of cortex. *p < 0.01, χ2 test.
(D) PV+ IN cell body positions.
(E) (Left) Percentage of PV+ INs as a function of normalized cortical depth. (Right) Cumulative percentage.
(F) Total percentage of PV+ INs in the top 50% (Superficial) versus bottom 50% (Deep) of cortex. p = 0.29, χ2.
(G) SST+(GFP−) IN cell body positions.
(H) (Left) Percentage of SST+(GFP−) INs as a function of normalized cortical depth. (Right) Cumulative percentage.
(I) Total percentage of SST+(GFP−) INs in the top 50% (Superficial) versus bottom 50% (Deep) of cortex. p = 0.37, χ2.
(J) Overlap of SST (IHC) and 5HT3A-GFP signal. p = 0.47, χ2 test.
(K) Cell densities. 5HT3A-GFP+ INs: control (n = 23 sections) versus cKO (n = 24 sections), p = 0.62. PV+ INs: control (n = 36 sections) versus cKO (n = 33 sections), p = 0.29. SST+(GFP−) INs: control (n = 35 sections) versus cKO (n = 36 sections), p = 0.57. t tests.
Error bars represent ± SEM.