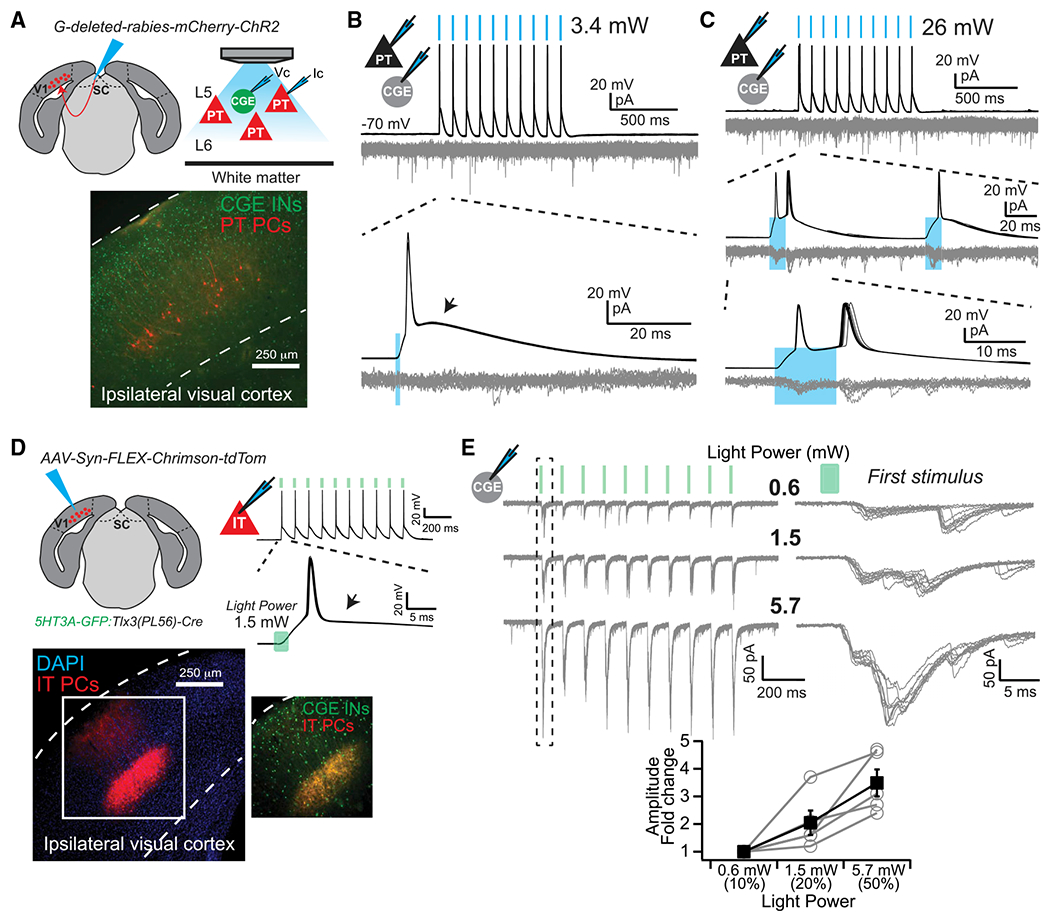
Figure 6. Population Input from PNs to CGE INs.

(A) Experimental design. Vc, voltage clamp; Ic, current clamp.
(B) Light stimuli (blue bars) evoked action potentials in infected PT PNs, without postsynaptic responses in INs. Depolarizing afterpotential (arrow). 10 overlaid trials.
(C) Long-duration (10 ms), high-power (26 mW) light stimuli (blue bars) were required to evoke rare, low amplitude postsynaptic responses in 5HT3A-GFP+ INs. Note doublet spiking in PT PN. 10 overlaid trials.
(D) Experimental design and example of 1.5 mW, 2 ms light stimuli evoked spikes. Lack of a depolarizing afterpotential (arrow). 10 overlaid trials.
(E) Amplitude of postsynaptic responses in CGE INs increase as a function of light power. 10 overlaid trials. Plotted are amplitudes of the first postsynaptic response evoked during a stimulus train, normalized to the lowest intensity (0.6 mW) (n = 5 cells). Error bars represent ± SEM.
