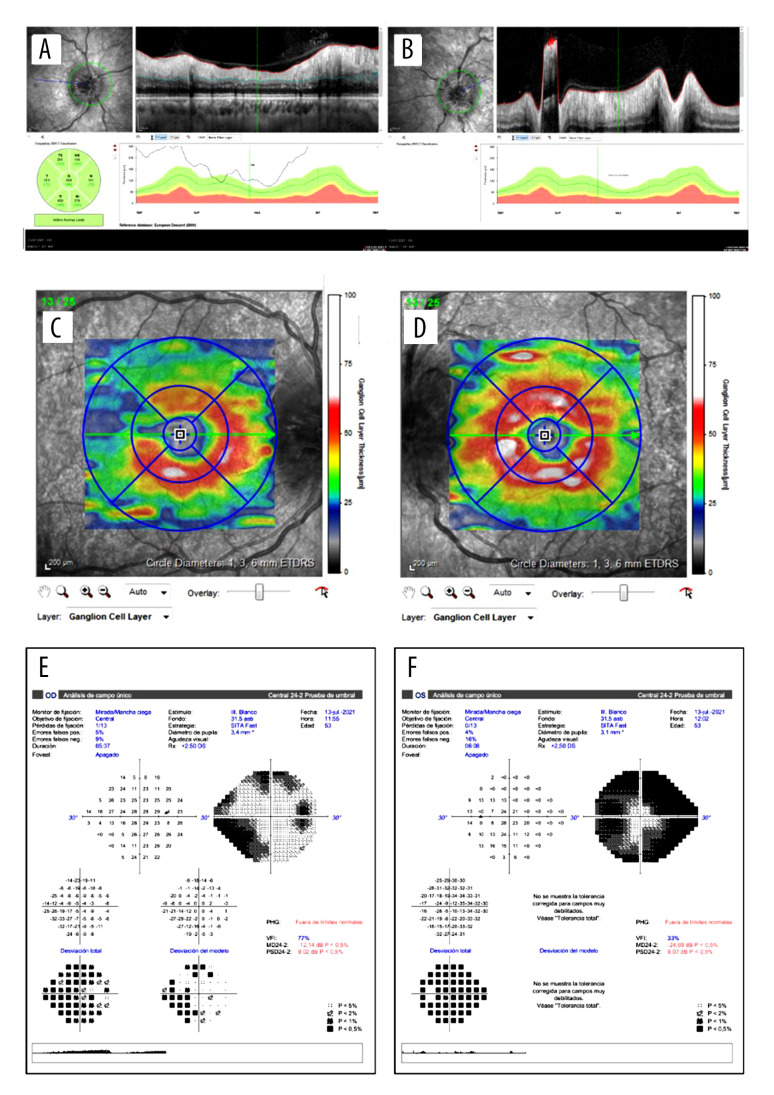
Figure 2.
OCT images and their functional correspondence by Humphrey 24-2 visual field. A and B show the retinal nerve fiber layer (RNFL) thickness of the right and left eye, respectively. It was not possible to measure the edema in the left eye at the critical moment. C and D illustrate the ganglion cell layer thickness of the right and left eye, respectively, showing a loss in the superotemporal quadrant of the right eye 3 weeks after the initial symptoms. The left eye remains at normal levels. E and F show the Humphrey 24-2 visual field of the right and the left eye, respectively. The right eye shows a lower nasal scotoma, while the left eye shows a constriction of the visual field.

