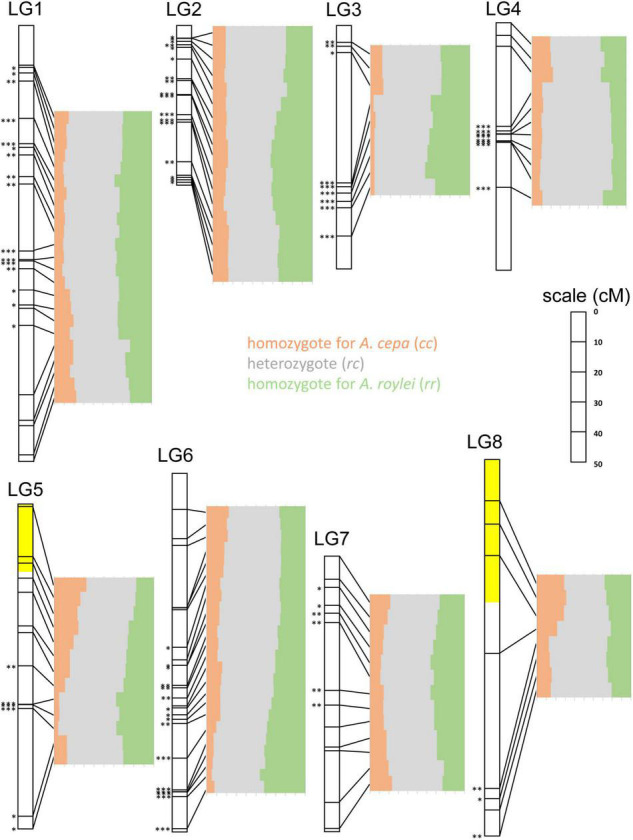
FIGURE 4.

Segregation of A. cepa and A. roylei alleles in F2 generation. Application of single nucleotide polymorphism (SNP) markers enabled visualization of segregation distortion of the regions along individual chromosomes [linkage groups based on genetic map of Scholten et al. (2016)]. Statistically significant deviation from the Mendelian 1:2:1 ratio of rr:rc:cc genotypes was tested by multinomial test, separately for each SNP marker (∗P < 0.05; ∗∗P < 0.01; ∗∗∗P < 0.001). Two regions showing (statistically non-significant) distortion toward A. cepa alleles are highlighted with yellow color.
