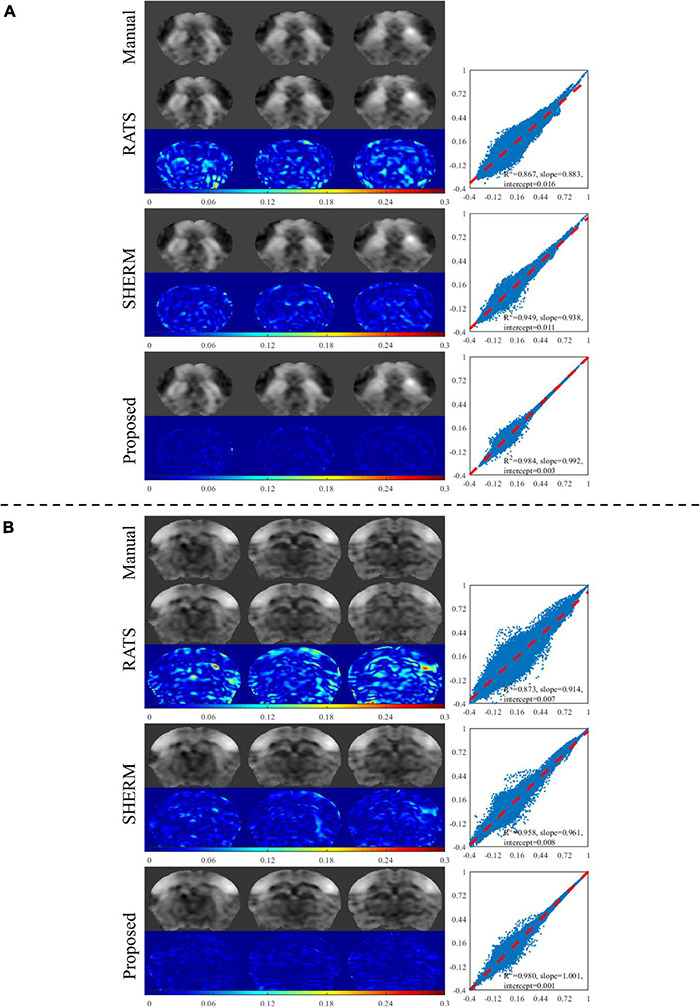
FIGURE 4.

Exemplary results of seed-based analysis for one mouse in the test data of D1. The selected seed regions were dStr and S1BF. The left column illustrates the CC maps with manual brain extraction and automatic skull stripping by RATS, SHERM and the proposed method for each dStr (A) and S1BF (B). The corresponding right column illustrates the scatters, where each point represents a pair of the two values from different CC maps with manual brain extraction and automatic skull stripping at the same pixel location.
