Figure 3.
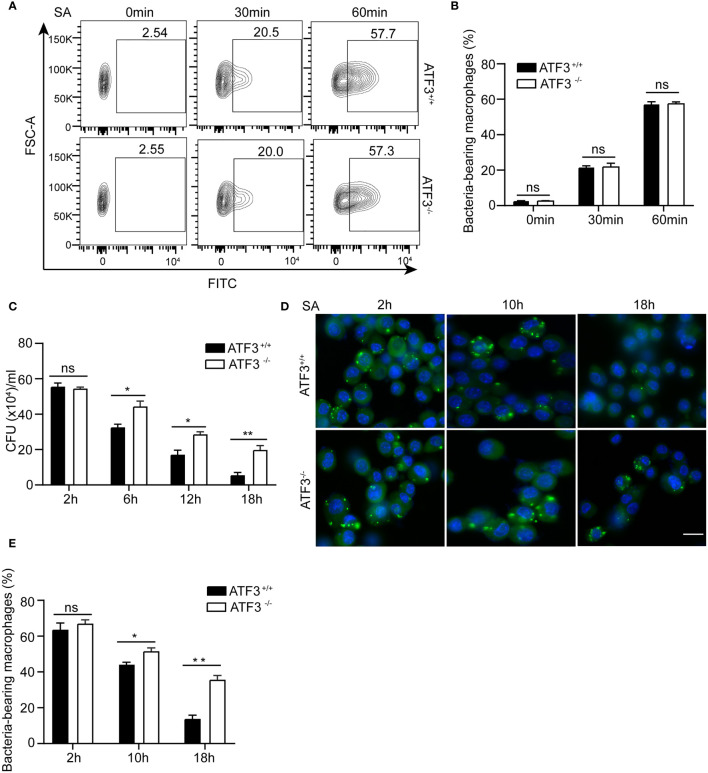
ATF3 enhances macrophage bacterial clearance ability. WT and ATF3 KO BMDM cells were infected with S. aureus (MOI = 1) for the indicated time periods. (A, B) The phagocytic ability was evaluated by taking up the percentage of macrophages with CFSE-labeled S. aureus. Representative plots and quantification by bar graphs from five independent experiments of flow cytometry are shown. (C) The bacterial load was measured and calculated in BMDM cells within the indicated time period after infection. (D, E) Intracellular bacteria measured by immunofluorescence microscopy. At 2, 10, and 18 h after infection, the uptake of S. aureus in BMDM cells is marked by CFSE (green). The nuclei are stained with DAPI (blue). Five representative images of each group were analyzed. Scale bar, 30 μm. ns, P > 0.05, *P < 0.05, **P < 0.01.

