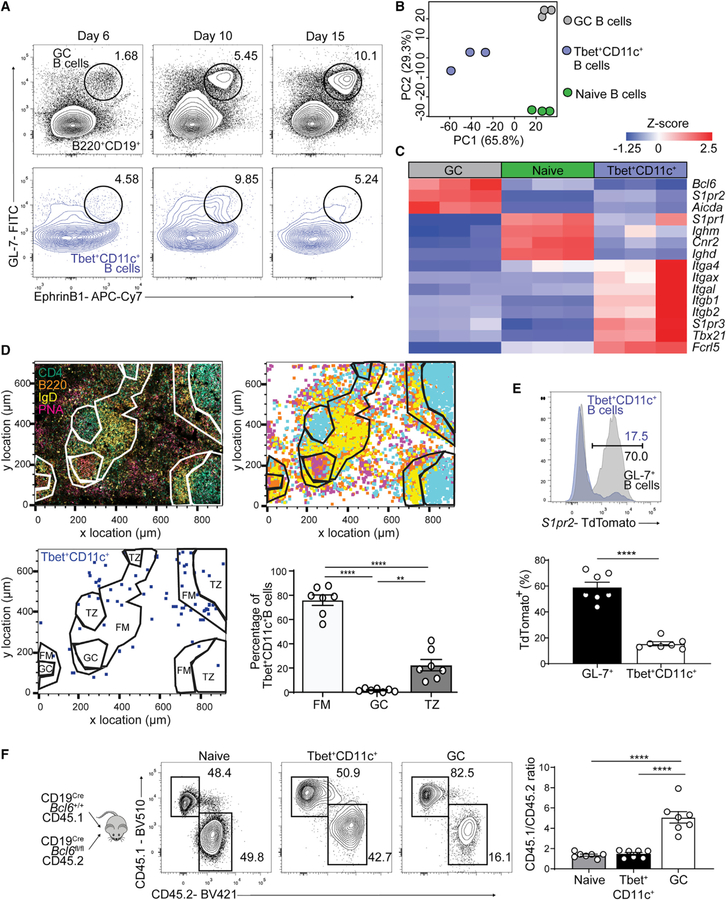
Figure 3. Tbet+CD11c+ B cells develop independently of GC B cells.
(A) GL-7 and EphrinB1 expression on B220+ IgDlo (black) and B220+ CD19+ CD44hi CD11c+ Tbet+ (blue) splenocytes from WT mice at days 6, 10, and 15 p.i. with gating for GC (B220+ IgDlo GL-7+ EphrinB1+) B cells.
(B) PCA of naive follicular (B220+ CD19+ IgDhi CD23+, green), GC (B220+ IgDlo CD95+ GL-7+, gray), and Tbet+CD11c+ (B220+ CD19+ CD44hi CD11c+ Tbet-AmCyanhi, blue) B cells sorted from Tbet-AmCyan reporter mice day 12 p.i.
(C) Heatmap of selected significantly (q < 0.05) differentially expressed genes.
(D) Confocal microscopy of spleens from Tbet-AmCyan reporter mice day 12 p.i. (top left); anti-CD4 (cyan), anti-B220 (orange), anti-IgD (yellow), and PNA (magenta). Shown is a histocytometric recreation of microscopy image plotting location of single cells gated as CD4+, B220+, IgD+, or PNA+ (top right). Location and quantification of Tbet+CD11c+ B cells (CD4− B220+ CD11c+ Tbet-AmCyan+) in splenic white pulp compartments: follicular mantle (FM), germinal center (GC), and T cell zone (TZ) on bottom.
(E) TdTomato expression of splenic GL-7+ (GL-7+ B220+ IgDlo) and Tbet+CD11c+ B cells at day 10 p.i.
(F) Experimental design of chimeric mice generated from CD45.1 CD19Cre Bcl6+/+ mixed with CD45.2 CD19Cre Bcl6fl/fl donor bone marrow cells. Frequencies and ratios of CD45.1 to CD45.2 cells in naive, GC, and Tbet+CD11c+ B cells in the spleens of mixed bone marrow chimeric mice at day 12 p.i. are shown.
**p < 0.01; ***p < 0.001; ****p < 0.0001 (D and F, one-way ANOVA; E, Student’s t test). Data are pooled from two independent infections with seven mice (D), are pooled from one experiment with nine mice (E), or are representative of two independent experiments with five mice per group (F). Bars represent means ± SEM.

