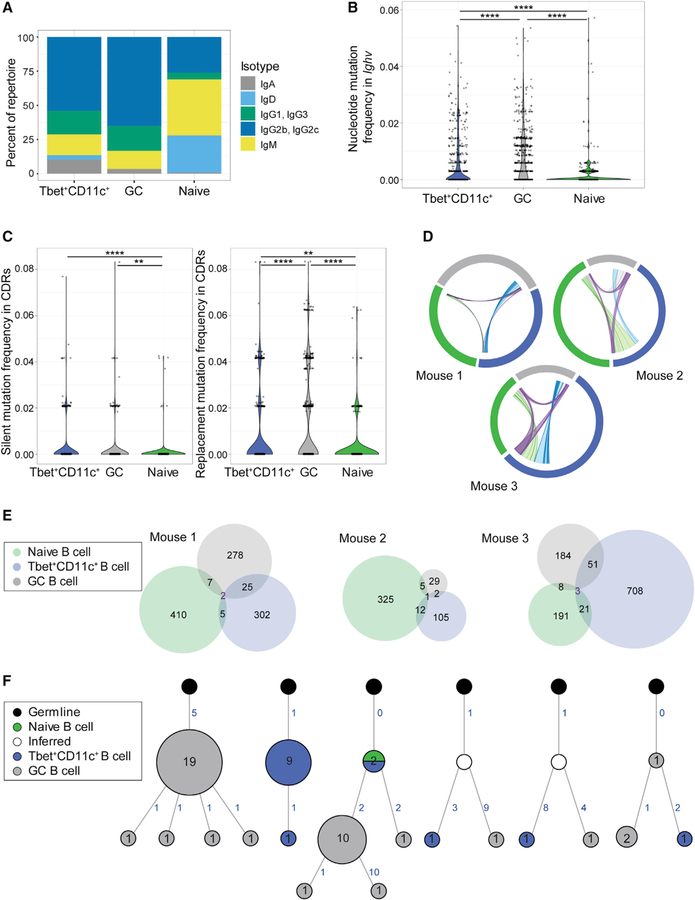
Figure 5. Ig repertoire analysis of Tbet+CD11c+ and GC B cells.
(A) Isotype distribution in Ig sequences of naive follicular (B220+ CD19+ IgDhi CD23+), GC (B220+ IgDlo CD95+ GL-7+), and Tbet+CD11c+ (B220+ CD19+ CD44hi CD11c+ Tbet-AmCyanhi) sorted from individual Tbet-AmCyan reporter mice day 12 p.i. with LCMV.
(B) Total mutation frequency within the Ighv gene.
(C) Frequencies of silent and replacement mutations within the complementary determining regions (CDRs).
(D) Clonal overlap of naive follicular (green), GC (gray), and Tbet+CD11c+ B cells (blue) sequences. Chords show clones shared by naive and GC (gray), naive and Tbet+CD11c+ (light green), GC and Tbet+CD11c+ (light blue), and all three subsets (purple) with chord width corresponding to clonal population size.
(E) Venn diagram showing numbers of shared clones between naive follicular (green), GC (gray), and Tbet+CD11c+ B cells (blue) sequences.
(F) Reconstructed lineage trees representative of most expanded clones (left three) and of shared clones between GC and Tbet+CD11c+ B cells (right three). Number of unique sequences at node with more than one unique sequence is shown to which the node size is proportional. Acquisition of somatic mutations is denoted by numbers in blue indicating number of mutations and branching, with the exception of the node directly connected to germline in each tree, which has the germline sequence.
**p < 0.01; ****p < 0.0001 (two-sided Dunn’s multiple comparisons test). Data are from one mouse representative of three biological replicates (A–C and F).

