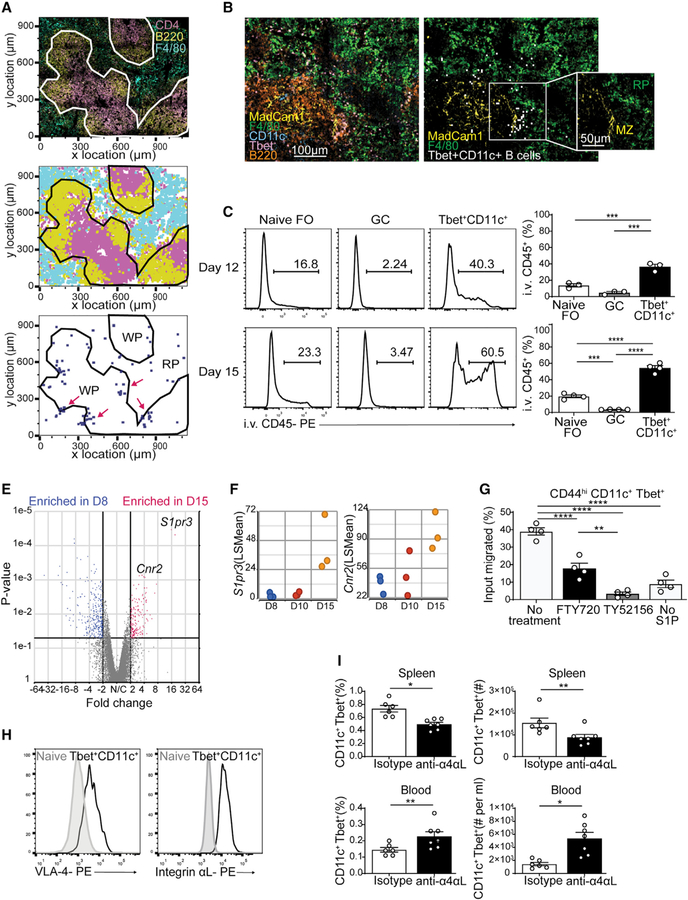
Figure 6. Integrin-dependent Tbet+CD11c+ B cell retention at the marginal zone.
(A) Confocal microscopy of spleens from Tbet-AmCyan reporter mice day 12 p.i. (top left), showing staining of anti-CD4 (magenta), anti-B220 (yellow), and anti-F4/80 (yellow). Shown is a histocytometric recreation of confocal microscopy image plotting location of single cells gated as CD4+, B220+, or F4/80+ (top right). Locations of Tbet+CD11c+ B cells (CD4− B220+ CD11c+ Tbet-AmCyan+) are shown in blue (clusters highlighted in magenta), along with splenic white pulp (WP) and red pulp (RP).
(B) Confocal microscopy of spleens from Tbet-AmCyan reporter mice day 15 p.i., showing staining of anti-MadCam1 (yellow), anti-F4/80 (green), anti-CD11c (cyan), and anti-B220 (orange), with Tbet-AmCyan (magenta). Tbet+CD11c+ B cells are identified through histocytometry (white), and the splenic compartments WP, RP, and marginal zone (MZ) were marked.
(C) I.v.-administered anti-CD45 antibody labeling of naive (B220+ CD19+ IgDhi CD23+), GC (B220+ IgDlo CD95+ GL-7+), and Tbet+CD11c+ (B220+ CD19+ CD44hi CD11c+ Tbet-AmCyanhi) at days 12 and 15 p.i. in Tbet-AmCyan mice.
(E) Volcano plot comparing gene expression of Tbet+CD11c+ B cells sorted and sequenced on days 8 and 15 p.i.
(F) Temporal expression of S1pr3 and Cnr2 from RNA-seq data in (E).
(G) S1P transwell assay measuring ratio of migrating to total input Tbet+CD11c+ B cells from Tbet-AmCyan reporter mice pretreated with inhibitors.
(H) VLA-4 and integrin αL expression on naive and Tbet+CD11c+ B cells at 15 p.i. in Tbet-AmCyan mice.
(I) Percentage and number of Tbet+CD11c+ B cells among total B cells after injection of LFA-1/VLA-4 blocking or isotype control antibodies.
*p < 0.05; **p < 0.01; ***p < 0.001; ****p < 0.0001 (C and G, one-way ANOVA; I, Student’s t test). Data are pooled from two independent infections (A, B, and I) or are representative of three independent experiments with three or four mice per group (C, H, and G). Bars represent means ± SEM.

