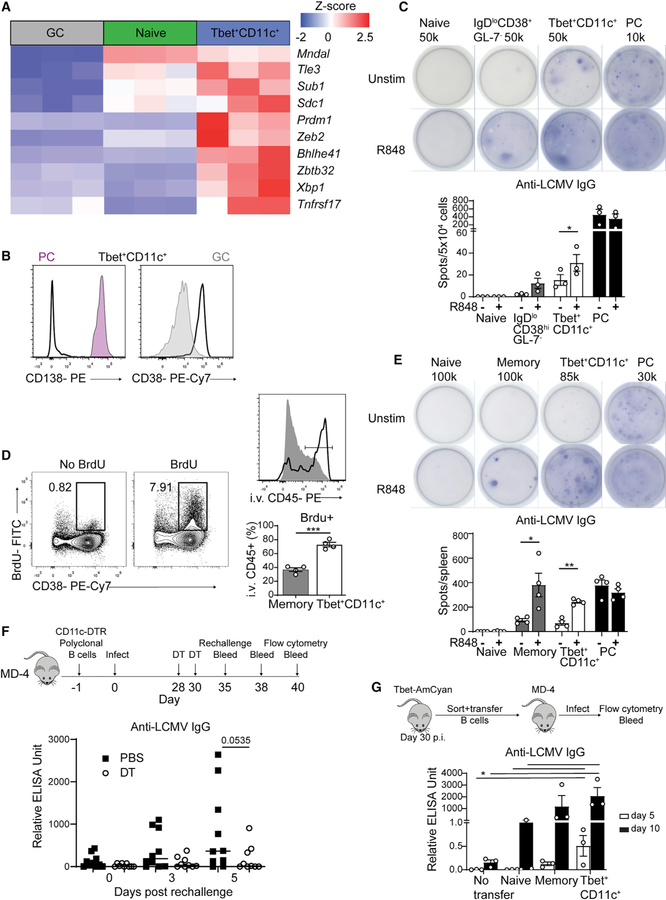
Figure 7. Tbet+CD11c+ B cells produce antiviral antibodies in both primary and recall responses.
(A) Heatmap of selected significantly (q < 0.05) differentially expressed genes in naive follicular, GC, and Tbet+CD11c+ B cells from RNA-seq data in Figure 3B.
(B) CD138 and CD38 expression of PCs (CD19int CD138+, pink), GC (gray), and CD11c+ Tbet+ B cells (solid line) in the spleens of Tbet-AmCyan reporter mice at day 10 p.i.
(C) Representative ELISPOT with number of cells plated per well and its quantification of sorted naive (B220+ CD19+ IgDhi Tbet-AmCyan−), IgDlo CD38+ GL-7− (B220+ CD19+ IgDlo CD38+ GL-7− Tbet-AmCyanlo/−), PCs (CD19int CD138+), and Tbet+CD11c+ B cells from spleens of Tbet-AmCyan reporter.
(D) BrdU and CD38 staining among B220+ CD19+ splenocytes from Tbet-AmCyan reporter mice at day 30 p.i. I.v.-administered anti-CD45 antibody labeling of BrdU+ memory (gray) and BrdU+ Tbet+CD11c+ B cells (black line).
(E) Representative anti-LCMV IgG ELISPOT (top) with number of cells plated per well and its quantification (bottom) of sorted naive, memory (B220+ CD19+ IgDlo CD38hi GL-7lo Tbet-AmCyanlo/−), PCs, and Tbet+CD11c+ B cells from spleens of Tbet-AmCyan reporter mice.
(F) Experimental design of polyclonal CD11c-DTR B cell transfer into MD4 mice. ELISA quantification of serum anti-LCMV IgG antibody of MD4 mice at days 0, 3, and 5 postrechallenge.
(G) Experimental design showing the transfer of all sorted naive, memory, and Tbet+CD11c+-B cells into MD4 mice. ELISA quantification of serum anti-LCMV IgG antibody of MD4 mice at days 5 and 10 p.i.
*p < 0.05; ***p < 0.001 (C–F, Student’s t test; G, one-way ANOVA). Data are representative of three (C and E) independent experiments or pooled from two independent experiments (F and G). Bars represent means ± SEM.

