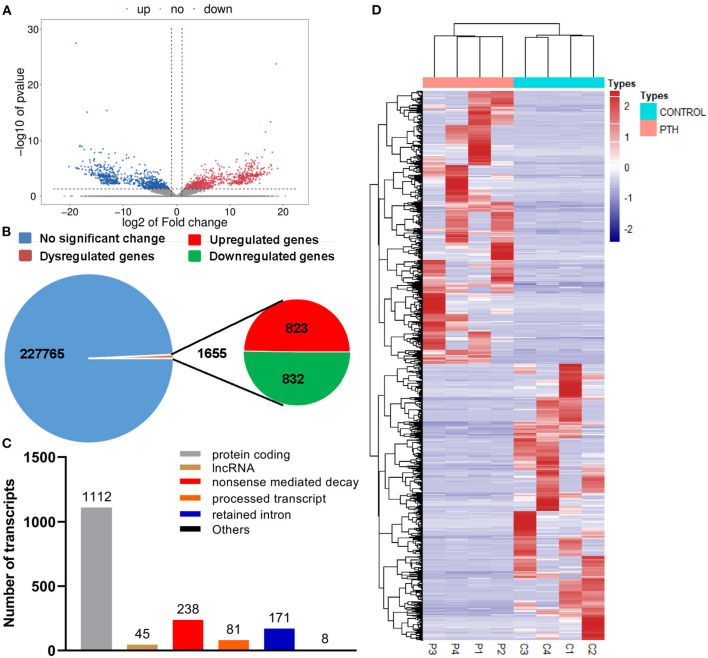
Figure 3.
Effect of parathyroid hormone (PTH) on the transcriptome profile of human umbilical vein endothelial cells (HUVECs). (A,B) Volcano plot (A) and statistical graphs (B) of differentially expressed genes (DEGs). (C) Number of differentially expressed transcripts. (D) Heat map of the DEGs. Red represents highly expressed genes; blue, low expression. DEGs were identified with corrected P < 0.05 and absolute fold change ≥2. C1-4 represents the control group; P1-4, the PTH-treated (100 pM, 24 h) group.

