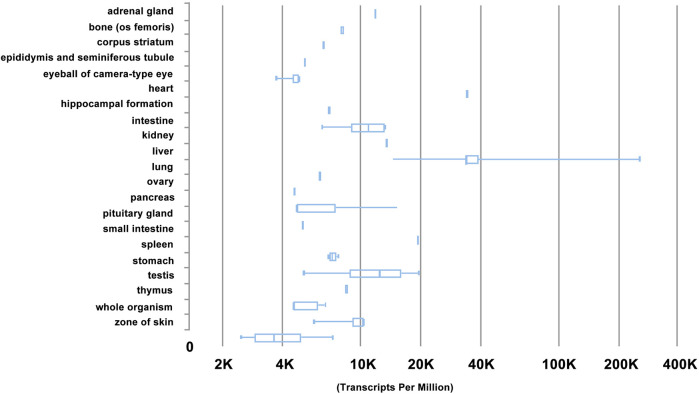
FIGURE 4.
Gene expression profile of HN by RNA-Seq CAGE (Cap Analysis of Gene Expression) analysis of mouse tissues in RIKEN FANTOM5 project. Note that HN is most abundantly in mouse tissue types of liver, heart, small intestine, and testis, based on https:// www.ebi.ac.uk/gxa/experiments/.

