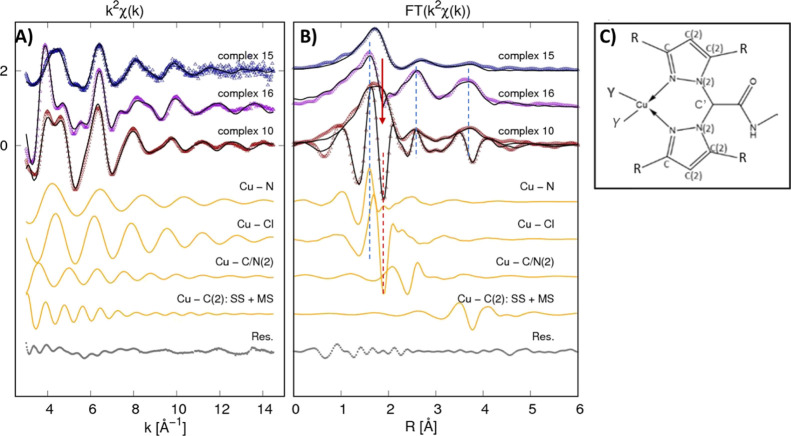
Figure 4.
(A) Cu K-edge EXAFS data analysis of complexes 10, 15, and 16 are reported. At the top, the experimental k2χexp(k) (dots) and best fit curves k2χfit(k) (black lines) are presented (vertically shifted for clarity). The middle curves (orange) represent the partial contributions used in the analysis of Cu(II) complex 10 (vertically shifted for clarity) for the sake of the example, and the lowest curve (gray) is the best fit residual k2(χfit – χth). (B) Corresponding FT moduli are shown for experimental k2 weighted EXAFS data (dots) and the best fit (black lines). The FT imaginary (Imm-FT) part of the experimental spectrum, best fit, and partial contributions are shown for complex 10 for the sake of an example. The dashed lines highlight in-phase Imm-FT oscillations for Cu–N and Cu–Cl contributions in Cu(II) complexes 10 and 16. The red arrow points out the structural signal lack in the region of the Cu–Cl shell (red dashed line) likely due to some antiphase structural signals. (C) Local structure around Cu is shown to highlight the neighbor shells involved in the analysis, being R = H (complex 10) or R = CH3 (complex 16) (see Scheme 1) and Y = Cl [Cu(II) complexes 10 and 16] and Y = P [Cu(I) complex 15].

