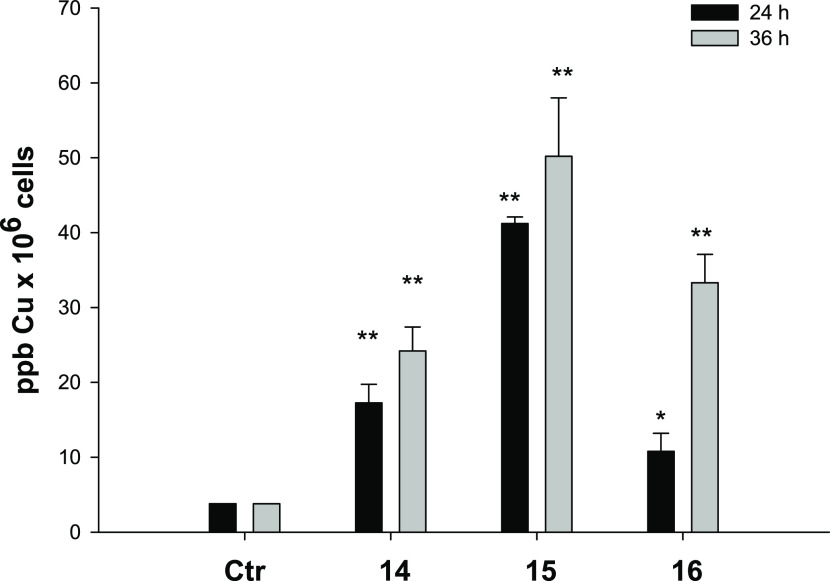
Figure 5.
Intracellular copper content after treatment with compounds 14–16. PSN-1 cells were treated for 24 or 36 h with 1 μM copper complexes, and the intracellular copper amount was estimated using GF-AAS analysis. Error bars indicate the standard deviation. *P < 0.1 and **P < 0.01 compared with the control.

