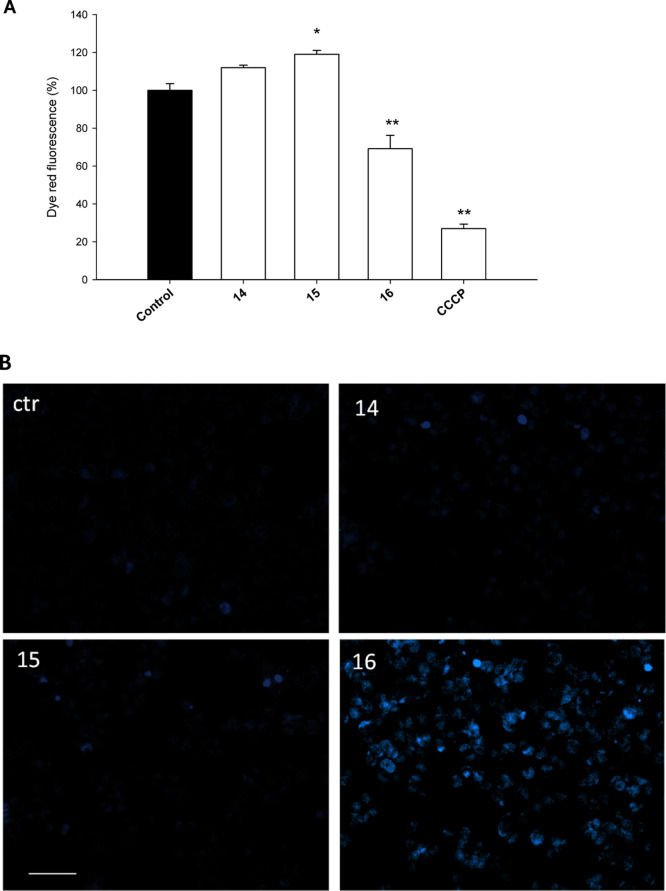
Figure 7.
(A) PSN-1 cells were treated for 24 h with IC50 concentrations of tested complexes or CCCP (3 μM). The mitochondrial membrane potential was determined using the Mito-ID membrane potential kit. Data are the means of three independent experiments. Error bars indicate the S.D. *P < 0.1 and **P < 0.01 compared with the control. (B) Hoechst staining of PSN-1 cells incubated for 48 h with IC50 doses of 14, 15, or 16.

