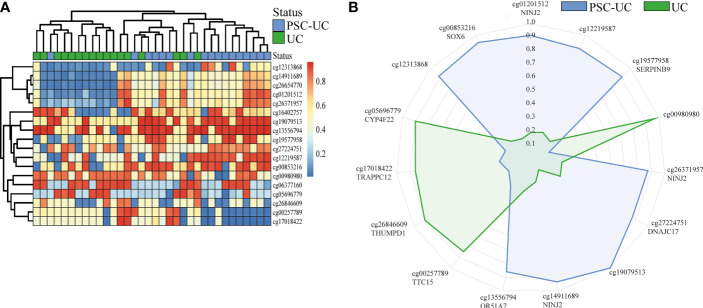
Figure 2.
Gradient boosting analysis distinguishes PSC-UC from UC. (A) Heatmap of 18 differentially methylated positions contributing to the predictive model distinguishing PSC-UC from UC. (B) Radar plot depicting the 15 most predictive CpG loci that are capable of distinguishing patients with PSC-UC from UC. The axes represent the mean scaled changes for the top 15 most discriminative CpG sites.

