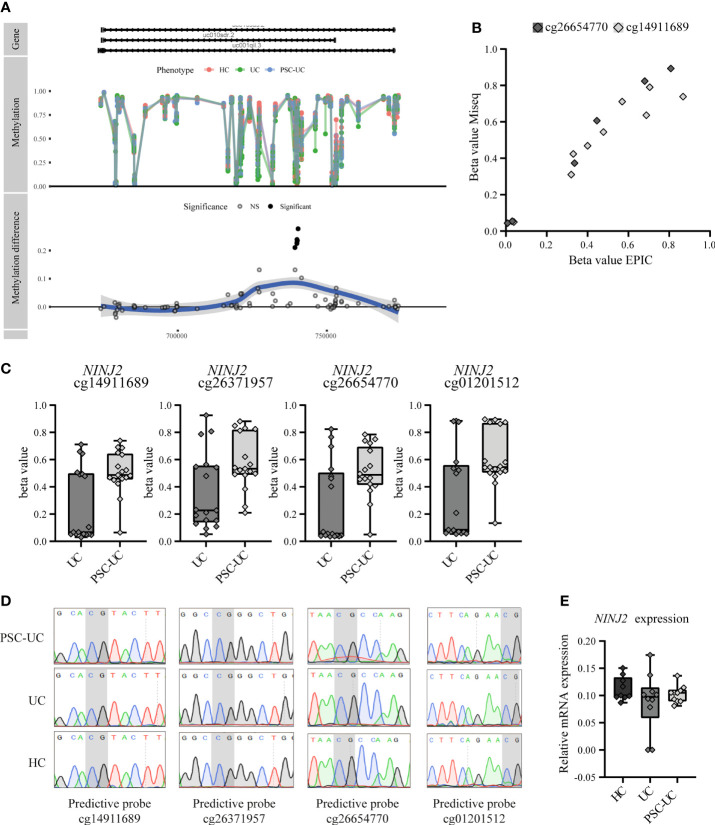
Figure 3.
Predictive CpGs annotated to NINJ2 were all hypermethylated in PSC-UC compared to UC patients. (A) Visualization of NINJ2 by plotting the actual percentage methylation for PSC-UC, UC and HC (“Methylation”) as well as the difference between PSC-UC and UC in percentage methylation (“Methylation difference”) relative to the position on the genome. (B) Visual correlation of the percentage methylation observed for cg26654770 and cg14911689 as calculated using the 850k DNA methylation array and through MiSeq sequencing for 5 PSC-UC, 2 UC and 2 HC patients. (C) Differences in percentage methylation (beta value) in patients with UC (n = 17) and PSC-UC (n = 17). (D) Representative images of Sanger sequencing traces surrounding the CpG loci of interest (marked in grey) that are annotated to NINJ2 in PSC-UC (n = 14), UC (n = 13) and HCs (n = 12). (E) Relative mRNA expression of NINJ2 normalized to the household genes GAPDH and HPRT in peripheral blood mononuclear cells of PSC-UC (n = 10), UC (n = 10) and HCs (n = 9).

