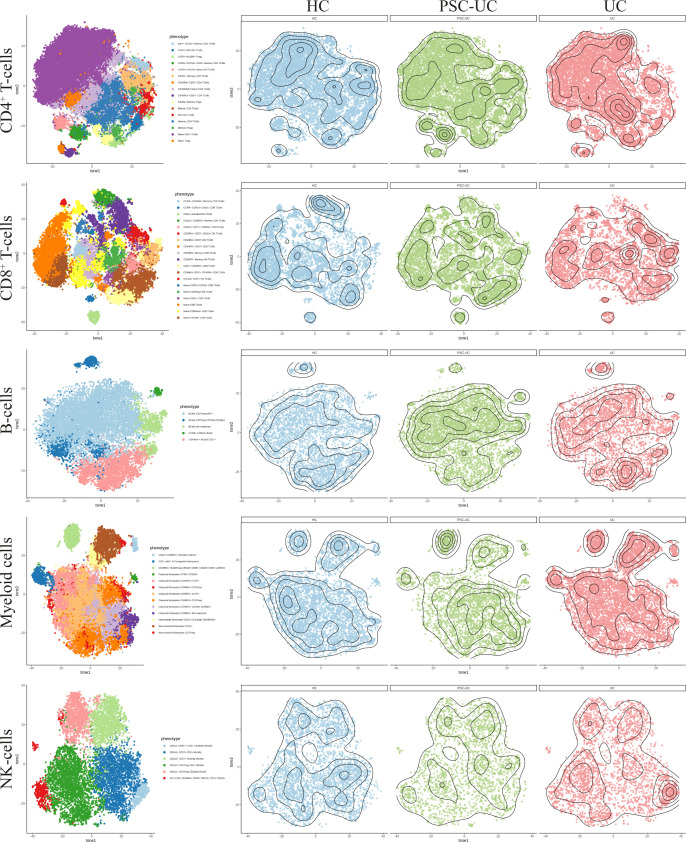
Figure 5.
High dimensional mass cytometry (cyTOF) analysIs reveals that peripheral blood cell distribution is comparable between patients with PSC-UC, UC and HC. The lineages CD4+ T-cells, CD8+ T-cells, B-cells, myeloid cells and NK cells were clustered for PSC-UC, UC and HC and color coded visualized using vISNE, a visualization tool for high dimensional single cell data based on the t Distributed Stochastic Neighbor Embedding (t-SNE) algorithm.

