
Fig. 4.
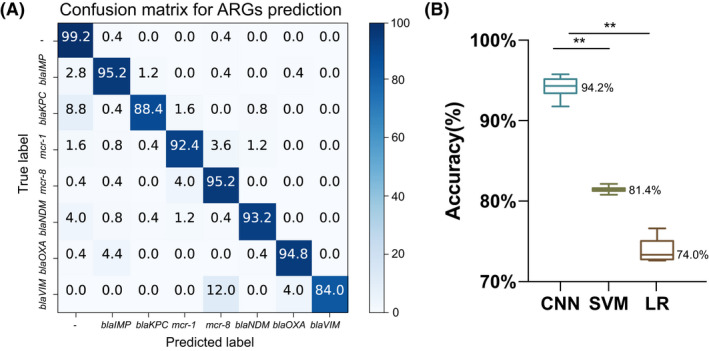
Three model performance breakdown by antimicrobial resistance genes (ARGs).
A. Confusion matrix for convolution neural network (CNN) models. Each row of this matrix represents the percentage of spectra in an actual class, whereas each column represents the percentage of spectra in a predicted class. The diagonal elements of this matrix show the percentage of correctly classified spectra, whereas the off‐diagonal elements indicate the percentage of misclassified ones.
B. The accuracy box plot to three types of models; *P < 0.05; **P < 0.001. LR, logistic regression; SVM, support vector machine.