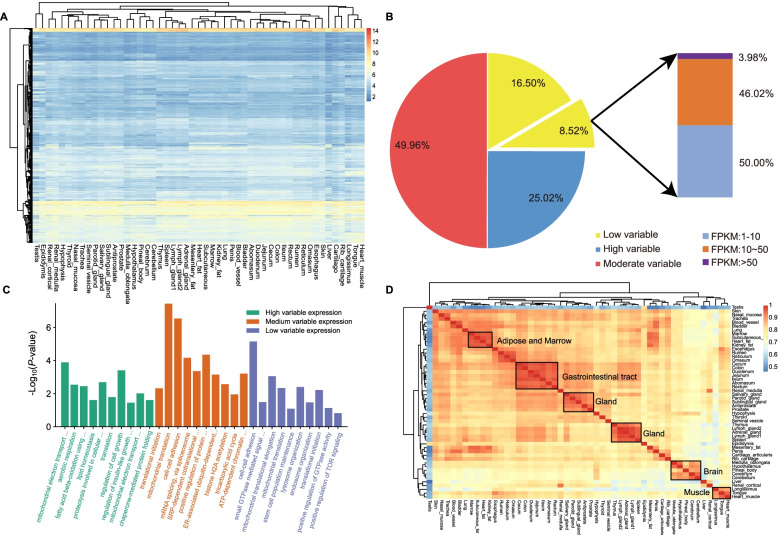
Fig. 3.
The expression pattern and hierarchical clustering of 2654 HKGs across 51 bovine tissues. a Clustering of expression patterns of housekeeping genes. Color intensity represents expression level estimated through log10 normalized FPKM. Red indicates high expression and blue indicates low expression. b The HKGs are variably expressed and only 8.52% are constantly expressed HKGs. Among those constant HK genes, only 3.98% are highly expressed with FPKM larger than 50. c Functional annotation of low variable expression, medium variable expression, and high variable expression of HKGs. d Hierarchical clustering heatmap based on Pearson’s correlation coefficient for HKGs. The red color represents high correlation and the blue color represents low correlation

