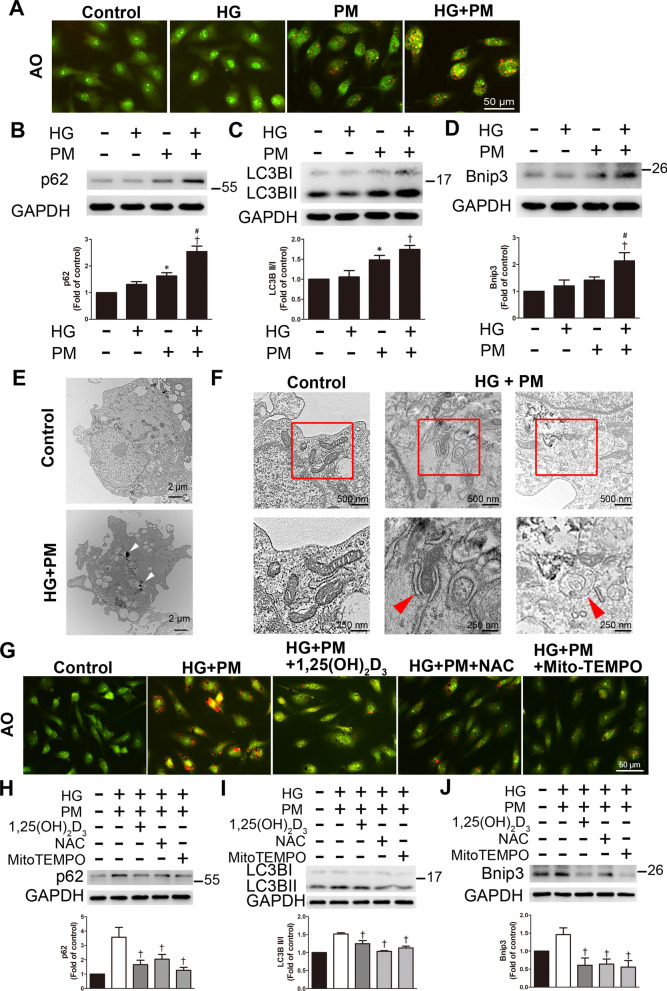
Fig. 4.
1,25(OH)2D3 reduced mitophagy induced by high glucose and PM exposure in HUVECs. HUVECs were pretreated with high glucose (30 mM) for 24 h and then treated with PM (50 μg/ml) for 8 h. A AO staining was used to detect the formation of autolysosomes and exhibited red fluorescence under a fluorescence microscope. Bar = 50 μm. B–D The levels of p62, LC3B, and Bnip3 expression were detected using Western blotting. E, F Transmission electron microscopy was used to detect the ultrastructure. White arrows indicated PM particles in the cytoplasm of HUVECs. Red arrows indicated the phagophore and the double-membrane autophagosome in the HG + PM group. Bars = 2 μm, 500 nm or 250 nm, as indicated in the panels. G HUVECs were pretreated with 100 nM 1,25(OH)2D3, 500 nM MitoTEMPO and 10 mM NAC for 12 h and 1 h before PM stimulation, respectively. AO was used to detect the autolysosomes. Bar = 50 μm. H–J HUVECs were pretreated with 100 nM 1,25(OH)2D3, 500 nM MitoTEMPO, and 10 mM NAC for 12 h and 1 h before PM stimulation, respectively. The levels of p62, LC3B and Bnip3 expression were assessed using Western blotting. *P < 0.05 compared with the control group; †P < 0.05 compared with the HG group or HG + PM group; #P < 0.05 compared with the PM group

