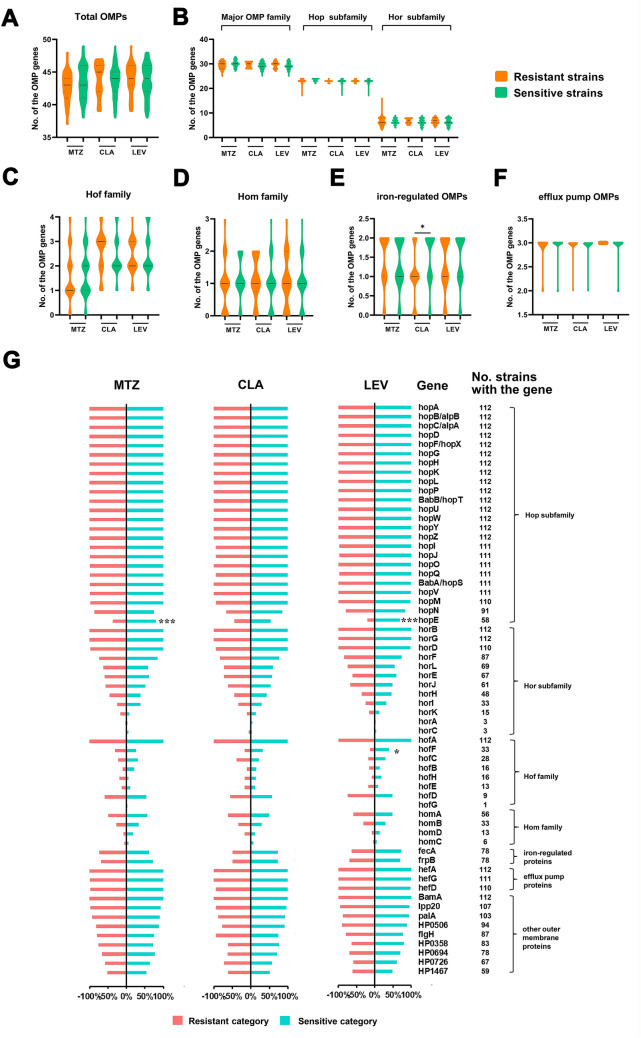
Fig. 2.
Analysis of OMP family genes in resistant and susceptible categories. Violin plots showing the distribution of the OMP genes in resistant and susceptible categories. The average presence levels of the total 62 OMP genes (A), the major OMP family genes along with two subfamilies genes (B), Hof family genes (C), Hom family genes (D), iron-regulated OMPs genes (F) and efflux pump OMP genes (F) in resistant and susceptible categories were compared, irrespective of the number of alleles of the genes. Solid lines indicate median levels and dotted lines indicate quartiles levels. G Proportion of strains with each OMP family gene in resistant and susceptible categories. Only genes with greater than 90% coverage were labelled as present. The number of strains containing the gene were listed on the right. A–G *P < 0.05, ***P < 0.001. Where there were no statistical analysis results labeled, there were no significant difference

