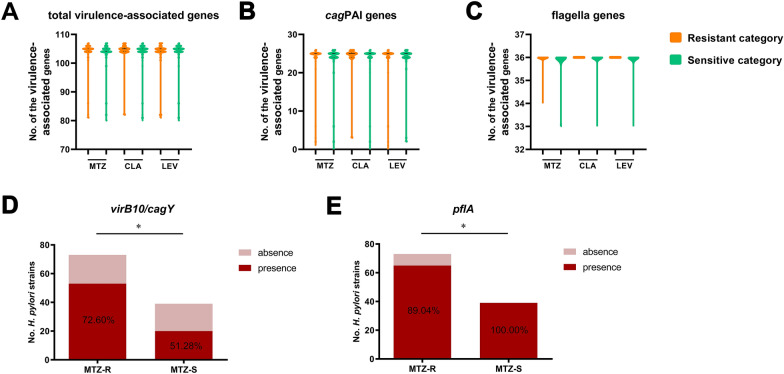
Fig. 3.
Analysis of virulence-associated genes in resistant and susceptible categories. Violin plots showing the distribution of the virulence-associated genes in resistant and susceptible categories. Comparisons of the average presence levels of the total virulence-associated genes (A), cagPAI genes (B) and flagellar genes (C) between resistant and susceptible categories were conducted, irrespective of the number of alleles of the genes. Solid lines indicate median levels and dotted lines indicate quartiles levels. Where there were no statistical analysis results labeled, there were no significant difference. D Two virulence-associated genes with significant different frequencies in MTZ-R and MTZ-S categories. *P < 0.05

