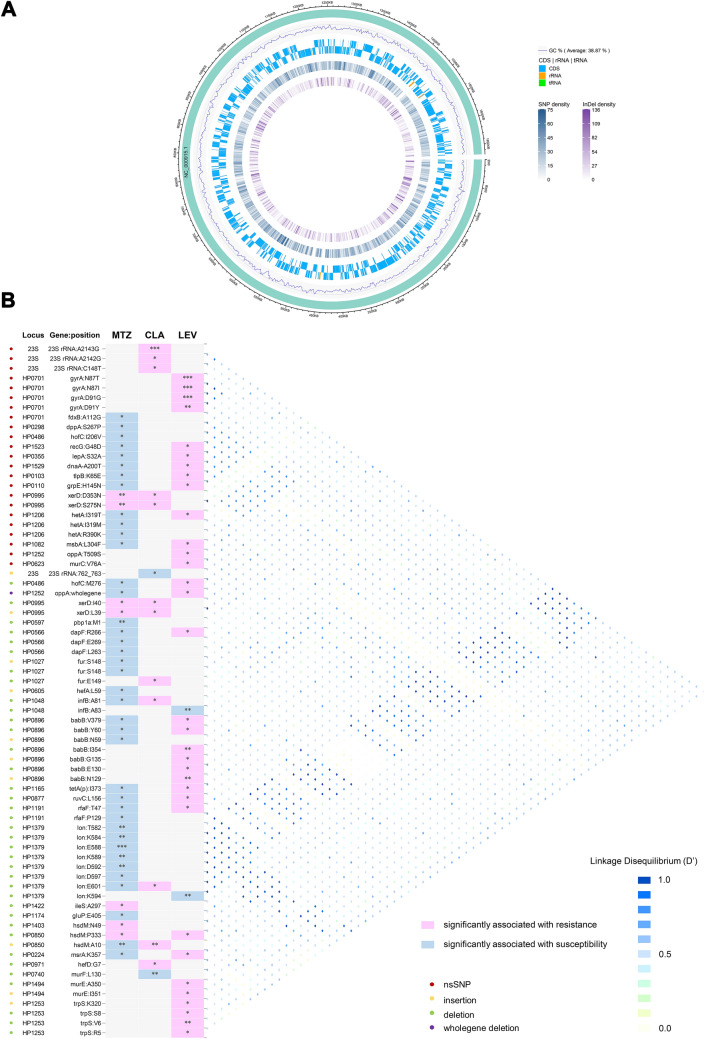
Fig. 7.
Synoptic representation of the genetic variations in the genome-wide resistance genes and linkage disequilibrium analysis. A The densities of total SNPs and Indels identified in the 112 H. pylori strains against H. pylori 26695 genome are overviewed. The numbers next to the rulers represent the number of SNPs and Indels per unit length of H. pylori 26695 genome. B The proportions of the strains with the nsSNPs and fsIndels present in the H. pylori genome-wide resistant genes in the resistant and susceptible categories of MTZ, CLA and LEV were analyzed, respectively. Only nsSNPs and fsIndels with significantly higher (red cells) or lower (blue cells) frequencies in the resistant categories of MTZ, CLA and LEV were displayed. *P < 0.05, **P < 0.01, ***P < 0.001. Conversely, grey cells indicate the variations not significantly associated with resistance or susceptibility to the antibiotics. Loci, genes, and variations are reported in rows and antibiotics in columns. The nature of the variations is color-coded on the left. The right panel represents the extent of linkage disequilibrium between variations

