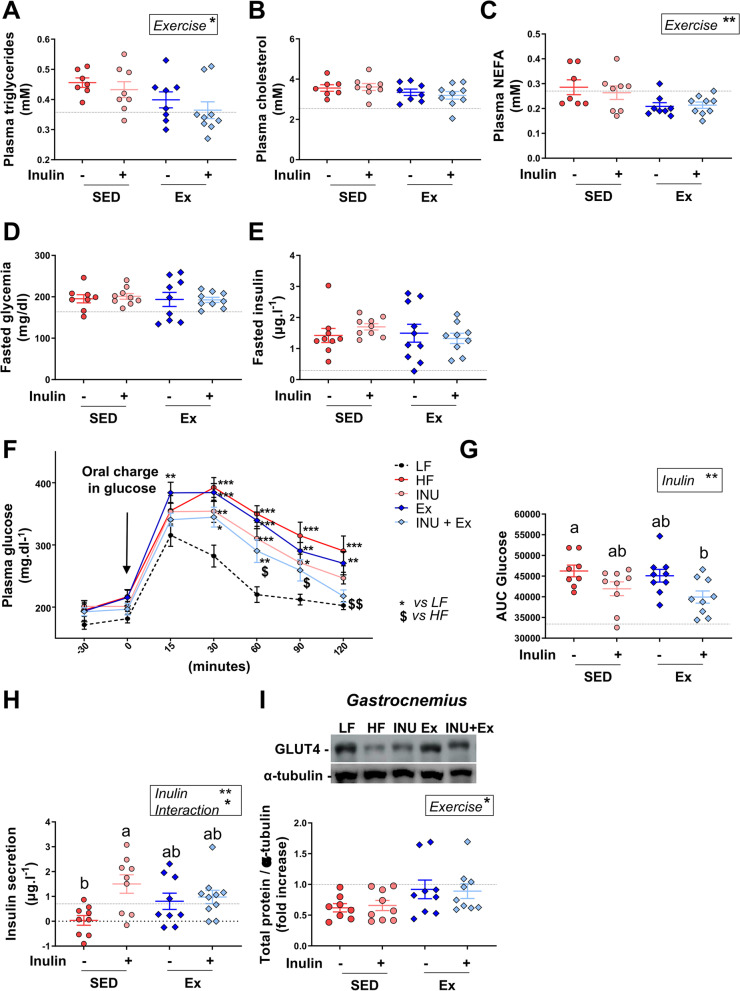
Fig. 5.
Voluntary exercise, combined with inulin supplementation, improved glucose tolerance in mice. A–C Fasted plasma triglycerides, cholesterol and NEFA. D Fasted plasma glucose (mg.dl−1). E Fasted plasma insulin (mg.L−1). F Glucose levels after an oral glucose load. G Area under the curve (AUC) of the glucose concentration evolution. H Insulin secretion corresponding to the difference of plasma insulin levels 30 min before and 15 min after the oral glucose load. I, J Immunoblotting and quantification of GLUT4 expression in gastrocnemius muscle, respectively. α-tubulin was used as protein loading control. Data are expressed as mean ± SEM. The black dotted line represents the mean obtained for the control group of mice fed with a standard diet. For the other four groups fed with a high-fat diet, a two-way ANOVA was performed, and significant results for each variable (inulin, exercise or interaction) are shown in the box. A Tukey post hoc test was then performed for comparison between groups and a different letter was attributed when the groups exhibit significant differences

