
FIGURE 4.
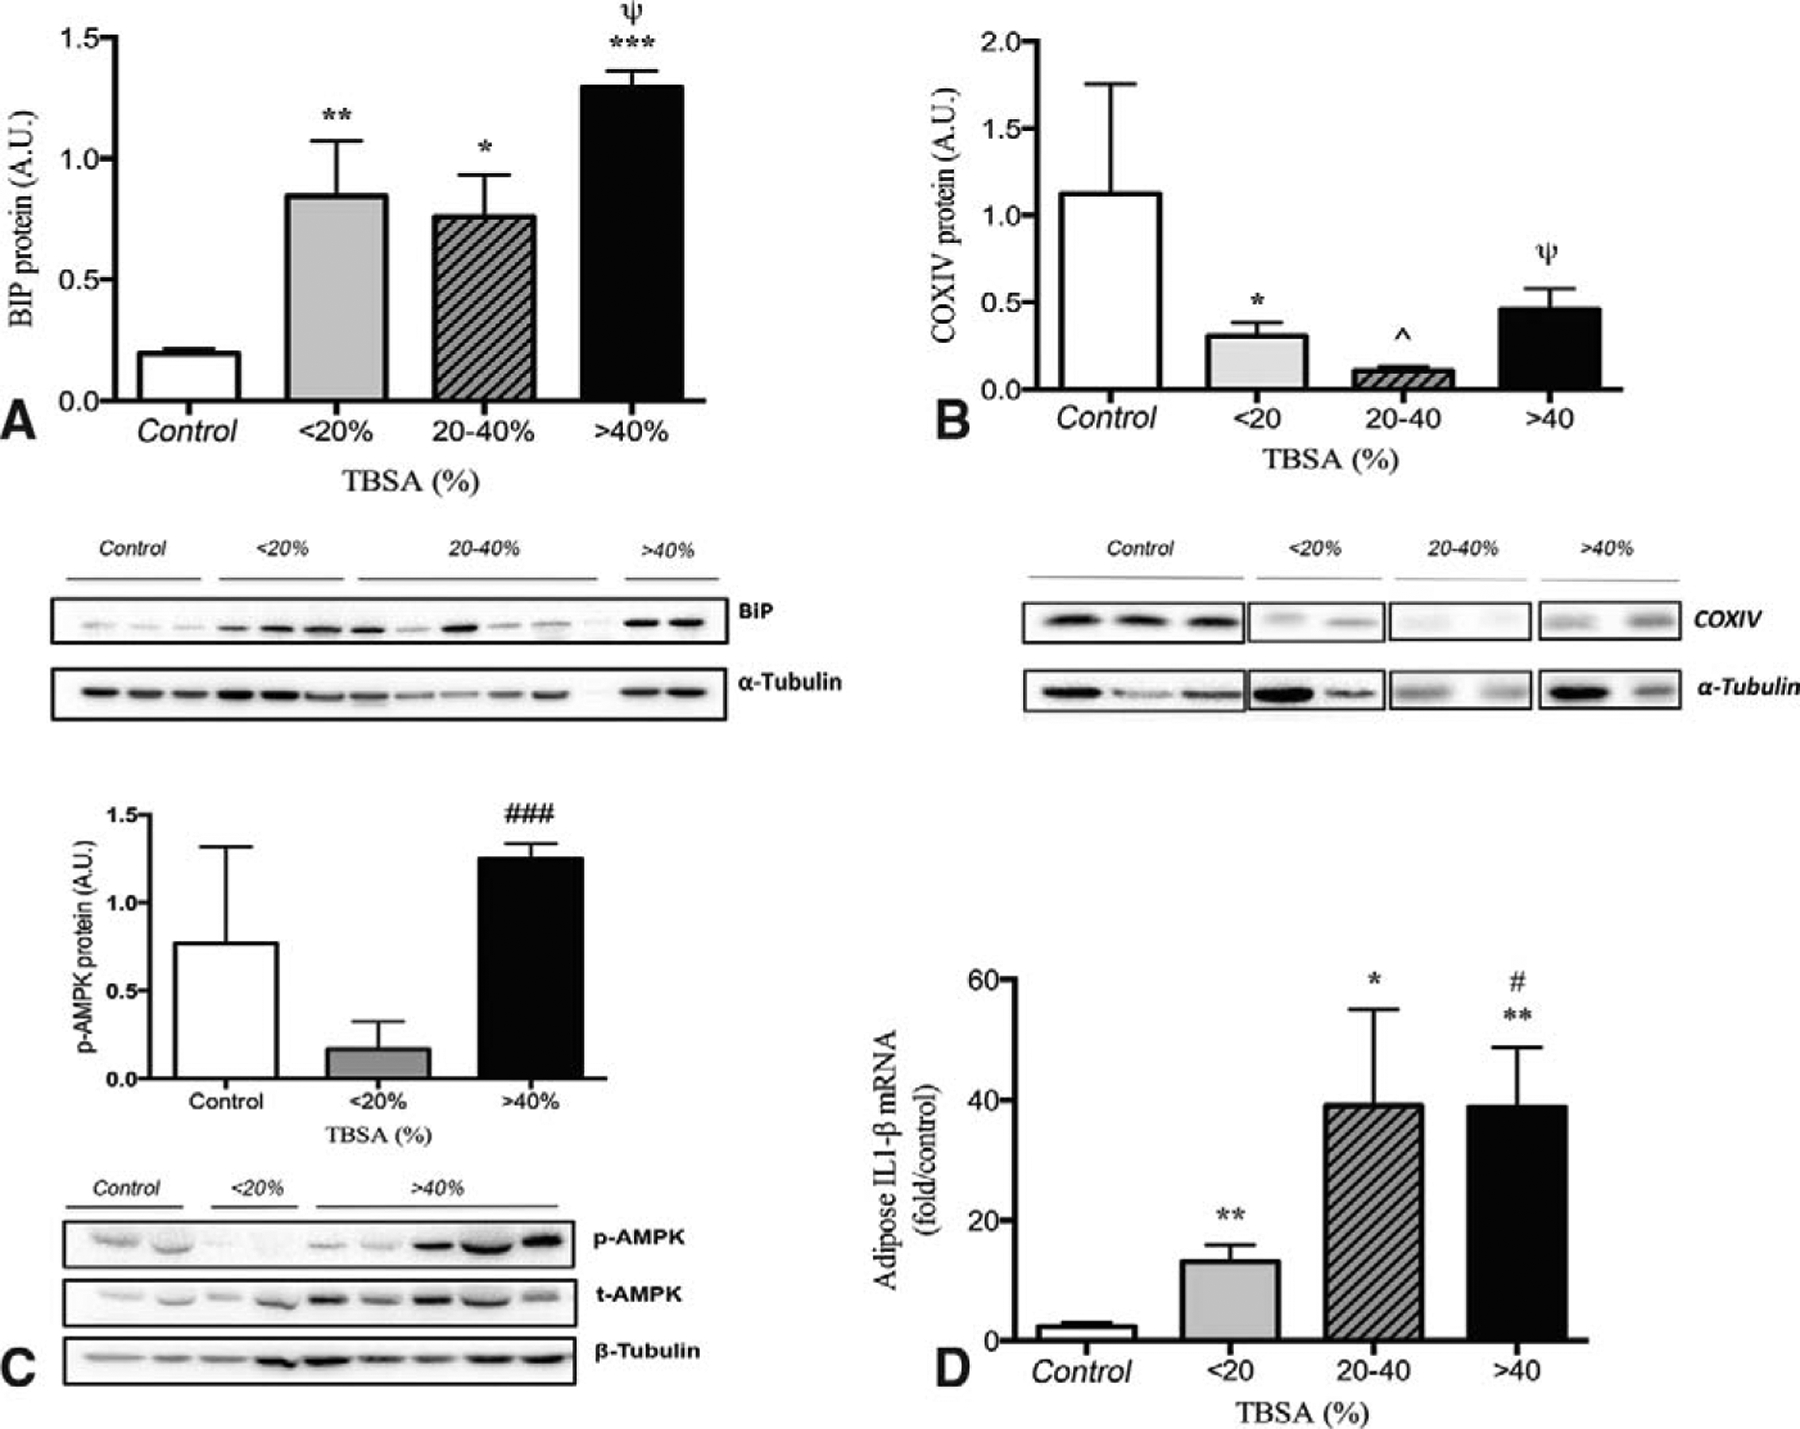
Metabolic markers of augmented response in WAT. ER stress marker BiP was upregulated in all burn groups relative to controls with highest proportion in >40 TBSA (A). Mitochondrial dysfunction was present and manifested by decreased expression of COXIV (B) and increased AMPK (C). As a measure of NLRP3 inflammasome activity, adipose tissue IL-1β was increased in all burn groups and increased with increasing burn severity (D). All tissues were taken within 7 days postburn. Data are represented as mean ± SEM.*, ** & *** = significant difference between controls (n = 5) and burned adults (n = 34); ^, ^^ & ^^^ = significant difference between < 20% TBSA and 20% to 40% TBSA; #, ## & ### = significant difference between <20% TBSA and > 40%TBSA; Ψ, Ψ Ψ & Ψ Ψ Ψ = significant difference between 20–40% TBSA and > 40% TBSA; P < 0.05, P < 0.01, and P < 0.001, respectively.