Fig. 2.
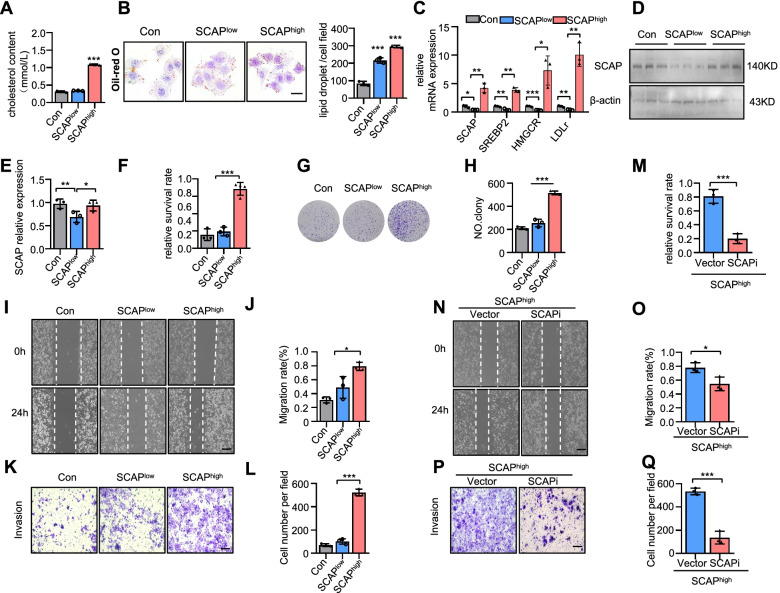
Disorders of the SCAP signalling pathway trigger sorafenib resistance in HCC cell lines. Loading LDL (100 ng/ml) and IL-1β (20 ng/ml) for 24 h simulated lipid disorders in HCC patients. The untreated group was defined as the control group. The LDL group was defined as SCAPlow group. The LDL and IL6 group was defined as SCAPhigh group. A Cholesterol contents in the SCAPlow and SCAPhigh cells (n = 3). B Representative images of each group stained with Oil Red O (n = 3). Bar = 50 μm. C mRNA expression of SCAP and downstream genes (SREBP2, HMGCR, LDLr) as measured by qRT-PCR (n = 3) in the SCAPlow and SCAPhigh cells (n = 3). D Immunoblot analysis of SCAP protein expression (n = 3). E The histogram represents the relative expression of SCAP. F The viability of sorafenib-treated cells with the above treatments. G, H Clone assays of cells with the above treatment (n = 3). Scratch-wound cell migration assays (I) and invasion assays (K) of cells with the above treatment (n = 3). Bar = 100 μm. The histogram represents the distance of cell migration (J) and invasion (L) in each group. Knockdown of SCAP in the SCAPhigh groups using a reverse siRNA transfection procedure. M The viability of sorafenib-treated vector and SCAP-knockdown cells (n = 3). Scratch-wound cell migration (N) and invasion (P) assays for the vector and SCAP-knockdown cells (n = 3) Bar = 100 μm. The histogram represents the distance of cell migration (O) and invasion (Q) in each group. Data are the mean ± SD. *P < 0.05, **P < 0.01, ***P < 0.001. P values were determined by one-way ANOVA in (A), (D), (F), (G), (I), (K), (L), (N), and (P) and repeated-measures ANOVA in (B)

