
Extended Data Fig. 1 |. In vitro assessment of SMN2-on cassettes.
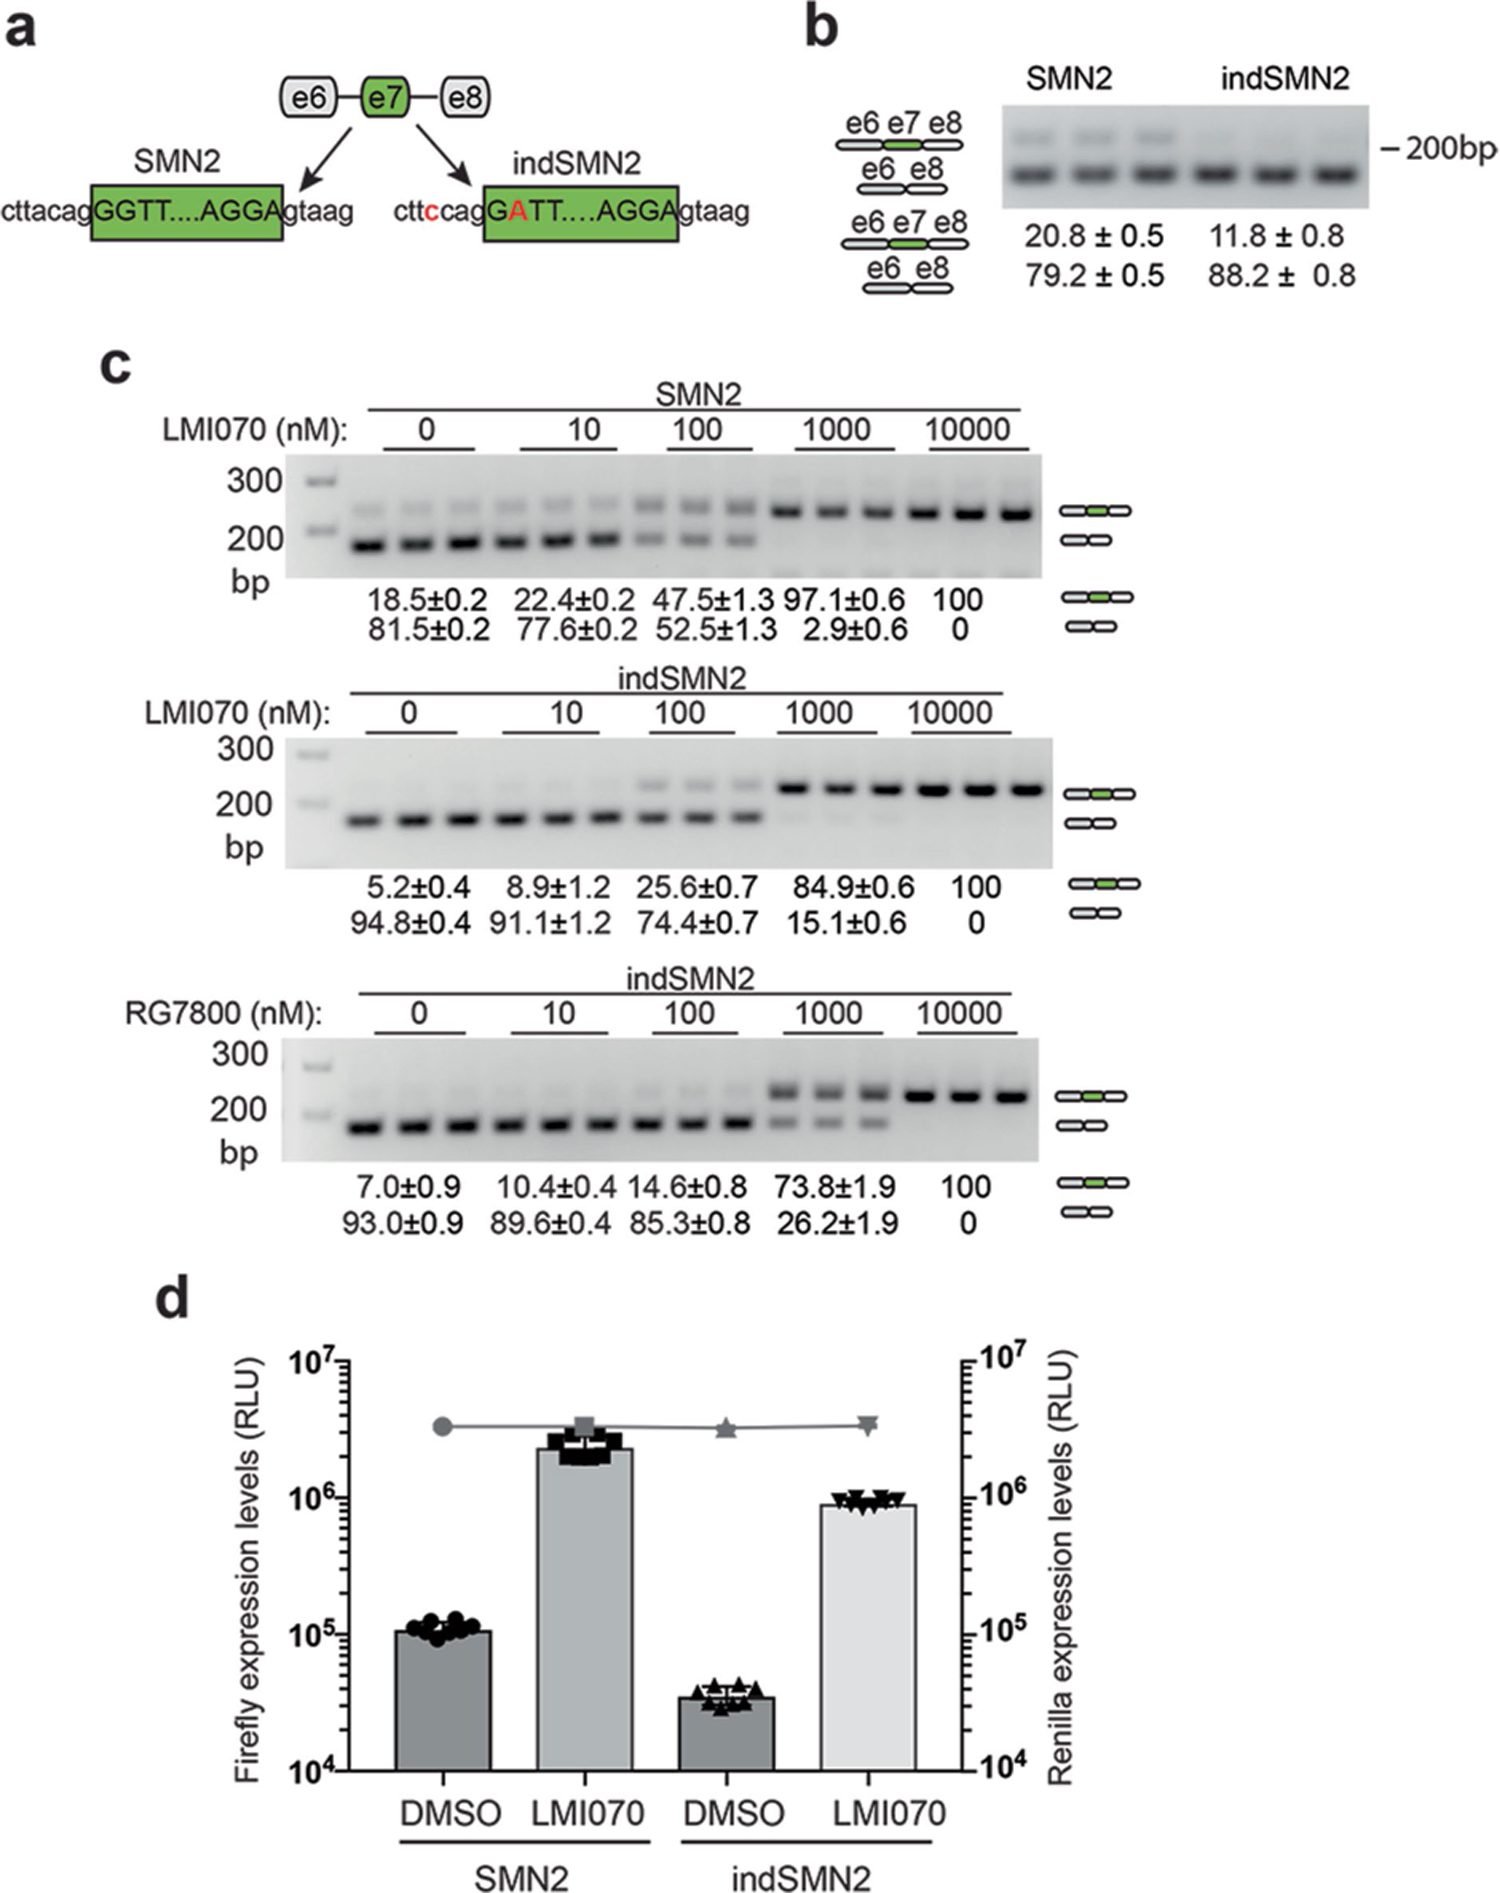
a, Cartoon depicting SMN2 exon 7 in its native sequence or with splice-site modifications introduced to reduce background levels of exon 7 inclusion (3′ acceptor splice site, indSMN2). b, Representative RT–PCR reaction showing exon 7 inclusion with the SMN2-on cassettes in the absence of LMI070. The quantification of the exon 7 spliced-in or -out transcripts is depicted as the mean ± s.e.m. of 6 biological replicates. c, Exon 7 splicing of the SMN2 and indSMN2 cassette in response to LMI070 or RG7800. Representative RT–PCR reaction showing exon 7 inclusion as a function of LMI070 or RG7800 dose. The quantification of the exon 7 spliced-in or spliced-out transcripts are the relative transcript levels presented as the mean ± s.e.m. of 8 biological replicates. d, Luciferase activity of the SMN2 and indSMN2 cassettes in response to LMI070. The graph shows relative expression of firefly luciferase expressed from the SMN2-on or indSMN2-on cassettes in cells treated with DMSO or LMI070 (100 nM). The activity of the transfection control Renilla luciferase cassette is represented as a line above the bar graph. Data are the mean ± s.e.m. of 8 biological replicates.