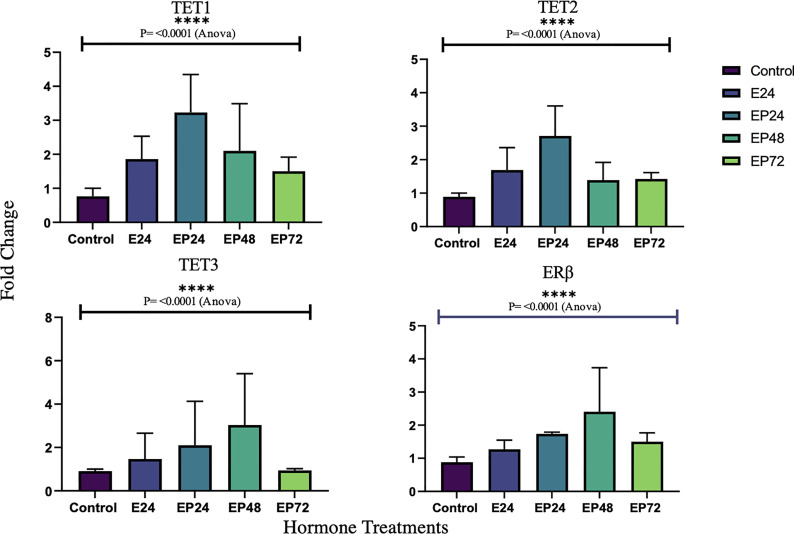
Figure 4.
Relative TET and ERb mRNA expression in response to different steroid hormone treatments in RL95-2 cells. The y-axis shows the fold change of mRNA levels following different treatments compared with control, all results corrected against geo-mean expressions of three reference genes - YWHAZ, RPLO and RPL13a. The x-axis shows different treatment groups E24 = 24h Estrogen; EP24, EP48 and EP72 = both Estrogen + Progesterone for 24, 48 and 72h. Data are presented as mean ± SEM; ***P < 0.001; P ≤ 0.1 was considered as approaching significance. One way ANOVA test revealed significant variations in TET and ERb expression across treatments (****P<0.0001). The experimental setup included three independent sets of cell culture experiments (n =3) and triplicates of each sample for the RT-PCR.

