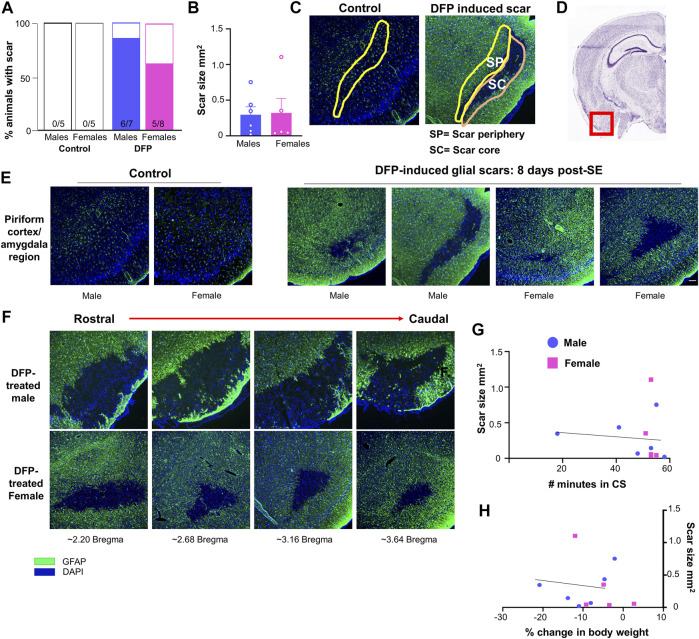
FIGURE 2.
Glial scar prevalence, shape, and size. (A) Percent of animals displaying a glial scar in male and female rats. (B) Average scar area comparison between male and females across sections. (C) Example of areas quantified in the scar core (SC) and scar periphery (SP). A similar region was analyzed in control animals. (D) Region imaged relative to the rest of brain (Image courtesy: Allen brain atlas, United States) (E) Representations of the variability in scar shape and size in the piriform cortex/amygdala region. (F) Scars often extended over multiple sections; images are from the same animal in the amygdala/piriform cortex region spreading from rostral to caudal. (G, H) Relationship between scar size and the number of minutes in a convulsive seizure (CS) during SE or the loss in body weight over the first three days post-DFP.

