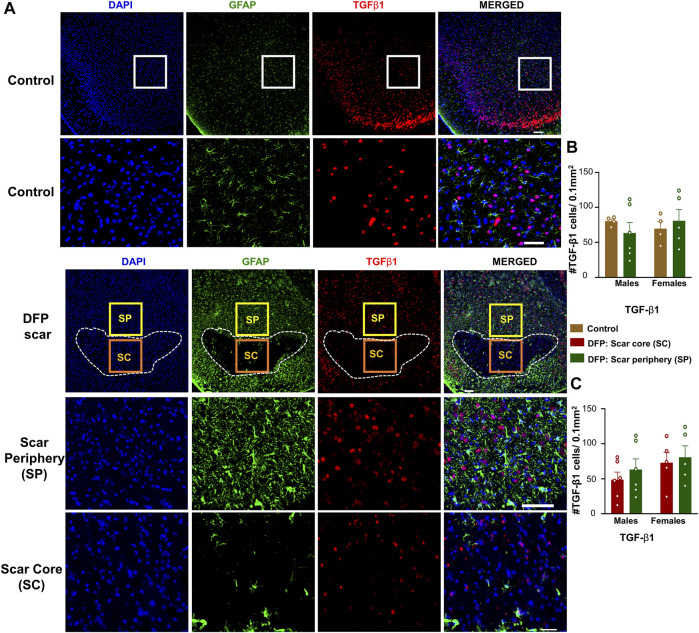
FIGURE 5.
TGF-β1 signaling in control animals and DFP treated animals with glial scarring. (A) Representative images for GFAP and TGF-β1. (B) The number of TGF-β1 positive cells in the scar periphery (SP) were compared to a similar region in controls. (C) Comparison of the number of TGF-β1 positive cells in the scar periphery and the scar core (SC). Mixed measures ANOVA, n = 4–6, *p < 0.05. Scale = 50 μm.

