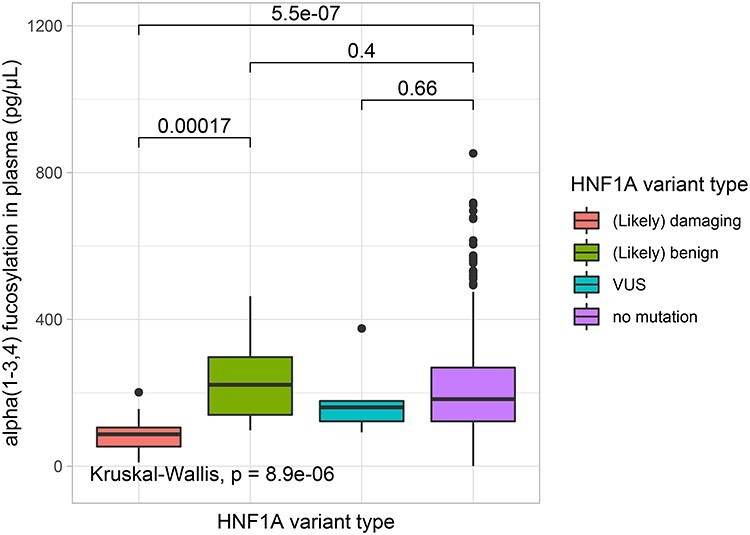
Fig. 2.

Box plots presenting differences in α1-3,4 fucosylation levels in blood plasma (pg/μL) measured using the exoglycosidase plate-based assay for groups of patients with different HNF1A variant groups. Each box represents 25th–75th percentile, the median is marked by a vertical line, whiskers indicate values that are within 1.5 × IQR of the hinge. Outliers are displayed as black filled circles. The lines and numbers above the box plots indicate the P-value when comparing two categories using The Wilcoxon–Mann–Whitney test. The analysis with P ≤ 0.05 is considered statistically significant. This figure is available in black and white in print and in colour at Glycobiology online.
