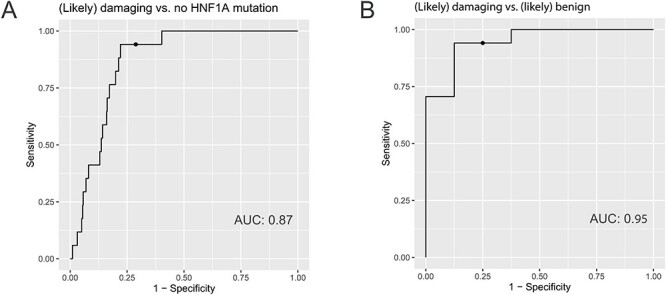
Fig. 3.

ROC curves illustrating the performance of α1-3,4 fucosylation levels in differentiating cases with (likely) damaging vs. no HNF1A variants (A) and (likely) damaging vs. (likely) benign variants in the HNF1A gene (B). The AUC values are displayed for each ROC curve. The optimal cut-off points are displayed as a dot on the precision recall curve for each ROC curve. This figure is available in black and white in print and in colour at Glycobiology online.
