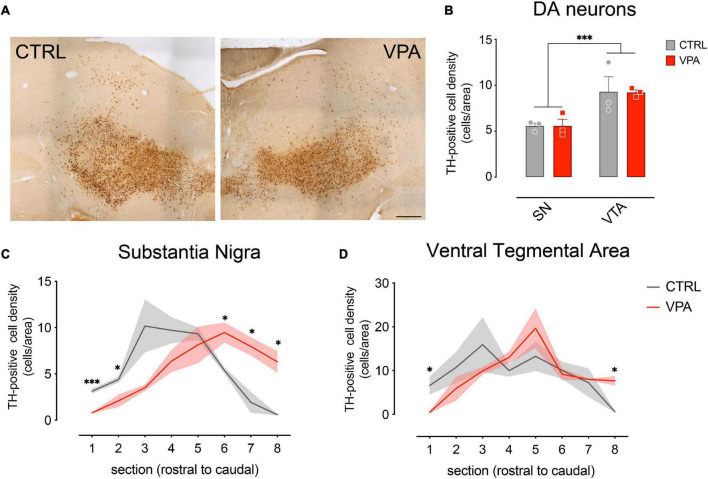
FIGURE 1.
Immunohistochemical analysis and quantification of cell densities. (A) Brain sections from CTRL and VPA chicks immunolabeled for Tyrosine Hydroxylase (TH). (B) Number of TH-positive DA neurons in both SN and VTA. TH-positive cells count was performed on 8 sets of serial sections per animal, sampled at 300 μm intervals. Rostro-caudal alignment of the brain sections was based on atlas reference (Plate 34 from Puelles et al., 2007). (C) Substantia Nigra DA cell density measured in its rostro-caudal distribution. (D) Ventral Tegmental Area DA cell density measured in its rostro-caudal distribution. Scale bar 500 μm. ∗p < 0.05, ∗∗∗p < 0.001.

