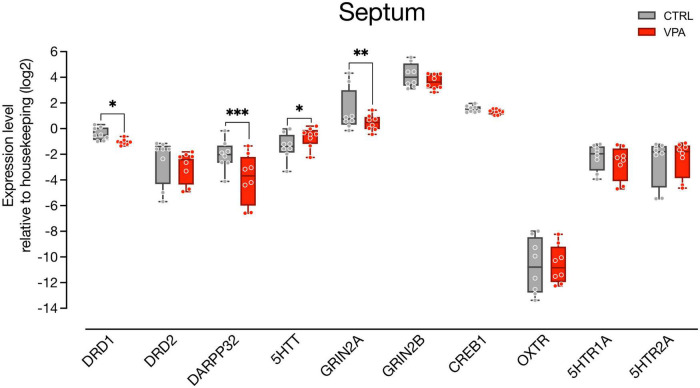
FIGURE 3.
Gene expression levels in the septum. Box and whisker plot (median, min to max) of relative expression (dCt, log2) values for each group. Changes in expression of DRD1, DRD2, DARPP32, 5HTT, GRIN2A, GRIN2B, CREB1, OXTR, 5HTR1A, and 5HTR2A in septum samples collected from P2 chicks embryonically exposed to VPA. ∗p < 0.05, ∗∗p < 0.001, ∗∗∗p < 0.0001.

