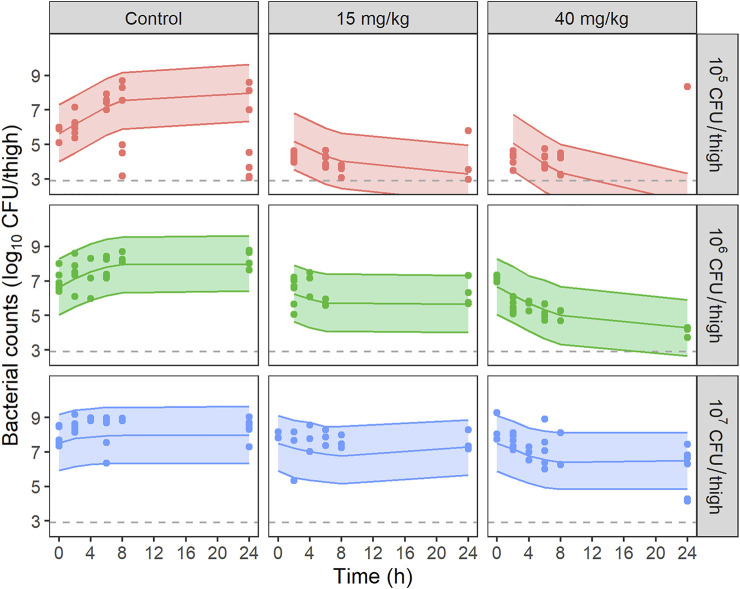
FIGURE 3.
VPCs of the final PKPD model for bacterial counts, stratified by dose of PMB and starting inoculum. Circles represent experimental data, solid lines the median of simulated data and, colored areas depict the 80% prediction intervals for 1,000 simulated profiles. Dashed lines correspond to the limit of quantification (2.9 log10 CFU/thigh).

