Figure 3.

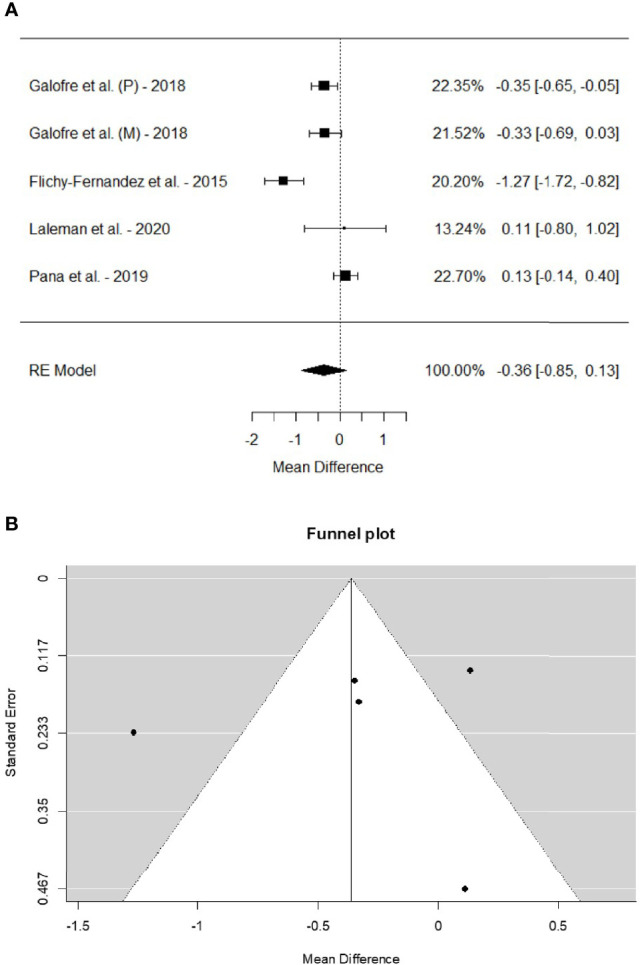
(A) Forest plot on the difference between the test and placebo groups in mean change in probing pocket depth before and after intervention. (B) Funnel plot depicting the publication bias for the studies included in the meta-analysis.

(A) Forest plot on the difference between the test and placebo groups in mean change in probing pocket depth before and after intervention. (B) Funnel plot depicting the publication bias for the studies included in the meta-analysis.