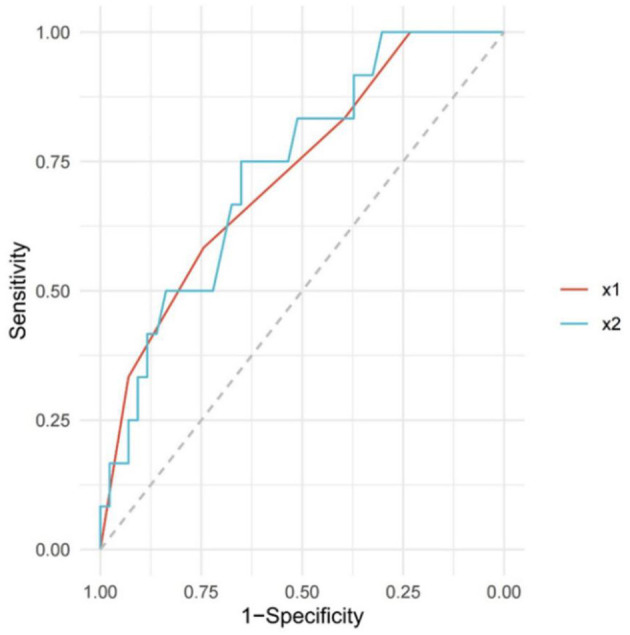
Figure 3.

Receiving operating characteristic (ROC) curve of pc-ASPECTS and OPT. The red solid line (x1) represents the boundary of the pc-ASPECTS area under the curve (AUC), and the blue band (x2) represents the boundary of onset-to-puncture time (OPT). The predictive performance indexes of this scale at different cutoff values are shown in Table 3. ROC, Receiver-operating Characteristic; OPT, Onset-to-puncture time; AUC, Authentication Center.
