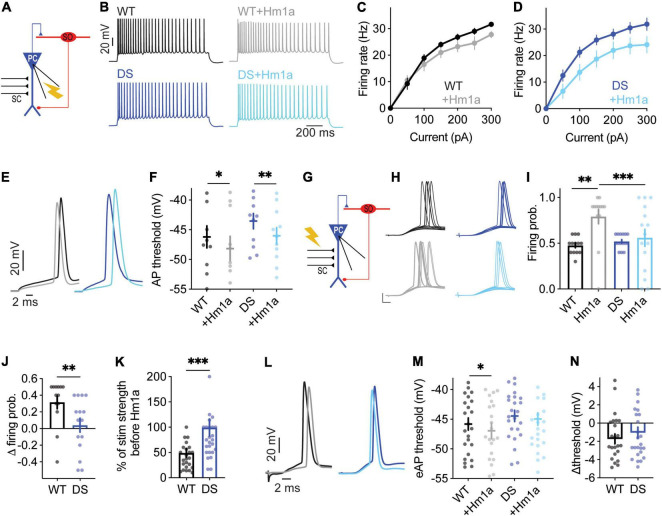
FIGURE 2.
Reduced evoked synaptic response of DS Scn1aA1783V/WT CA1 pyramidal neurons to Hm1a application. (A) Illustration of the recording configuration. Neuronal firing of CA1 pyramidal neurons (blue) was evoked by injection of depolarizing current through the patch pipette. (B) Representative traces of whole-cell current clamp recordings from CA1 pyramidal neurons in response to current injection of +150 pA, before and after Hm1a application. (C,D) The effect of Hm1a on firing in response to current injection through the whole-cell patch electrode in WT (C) and DS (D) CA1 pyramidal neurons. Statistical analysis utilized Mixed Model Analysis of Variance; (C) p = 0.08 for Hm1a treatment, p = 0.06 for current × treatment; (D) p = 0.07 for Hm1a treatment, p = 0.09 for current × treatment. (E) Representative WT and DS APs at rheobase, before and after Hm1a application. (F) The effect of Hm1a on AP threshold at rheobase current. Statistical analysis utilized Two Way Repeated Measures ANOVA. The markings on the graph depict the results of Bonferroni post hoc analysis: p = 0.30 for genotype; p < 0.001 (***) for Hm1a treatment, and p = 0.58 for the interaction. The data in (C–F) included: WT: n = 11 cells from 4 mice; DS: n = 16 cells from 3 mice. (G) Schematic illustration of the SC stimulation and whole-cell recording of a CA1 pyramidal neuron. (H) Representative traces of WT and DS CA1 pyramidal neurons in response to a train of 10 stimuli at 1 Hz, delivered to the SC, with or without Hm1a. Scale bar = 20 mV, 5 ms. (I,J) The effect of Hm1a on the firing probability of WT and DS CA1 pyramidal neurons (I), and the difference in firing probability calculated for each cell (J). Statistical analysis for the data presented in I utilized Two Way Repeated Measures ANOVA. The markings depict the results of Bonferroni post hoc analysis: p = 0.036 (*) for genotype; p = 0.070 for Hm1a treatment; p = 0.002 (**) for the interaction. The Mann–Whitney test was used to analyze the data in (J). (K) The effect of Hm1a on the stimulation intensity required to produce 50% firing probability. Statistical analysis utilized the Mann–Whitney test. (L–N) Representative traces of eAPs before and after Hm1a application (L), the overall effect of Hm1a on the eAP threshold (M), and the difference in eAP threshold (N). Statistical analysis utilized Two Way Repeated Measures ANOVA. The markings depict the results of Bonferroni post hoc analysis: p = 0.3 for genotype; p = 0.019 (*) for Hm1a treatment; p = 0.19 for the interaction. The data in (I–N) included WT: n = 25 cells from 9 mice; DS: n = 27 cells from 8 mice.

