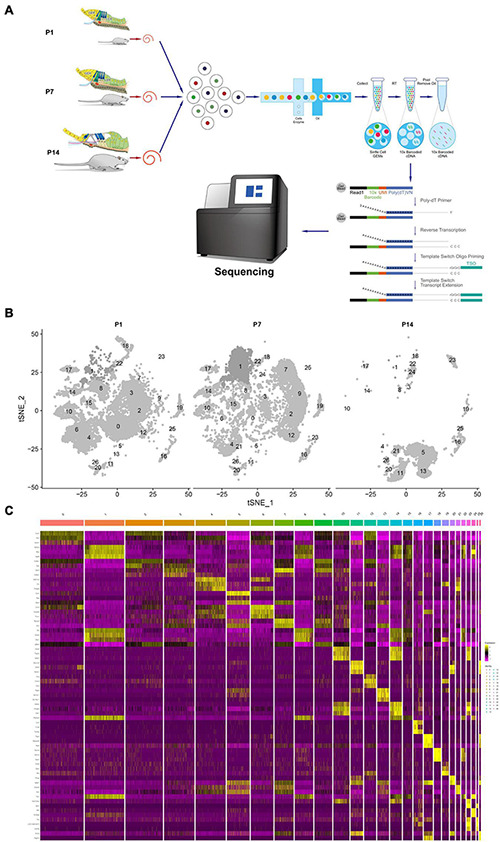
FIGURE 1.

Global expression profiling of cochlear duct cells by scRNA-Seq and cell clusters identification from P1, P7, and P14. (A) Cross-section diagrams of the cochlear canals, and the scheme of cochlear duct preparation, single-cell isolation, and Chromium 10× Genomics library and scRNA-seq at P1, P7, and P14. (B) t-SNE plots of cochlear cell clusters at P1 (left), P7 (middle), and P14 (right) based on the origins (number) are shown. (C) Heat map for cochlear duct cell clusters. The top three differentials expressed (DE) genes for the 27 identified clusters are shown. Cellular identity for each cluster is indicated by a color bar at the top of the heat map. The color ranges from blue to bright yellow indicates low to high gene expression levels, respectively.
