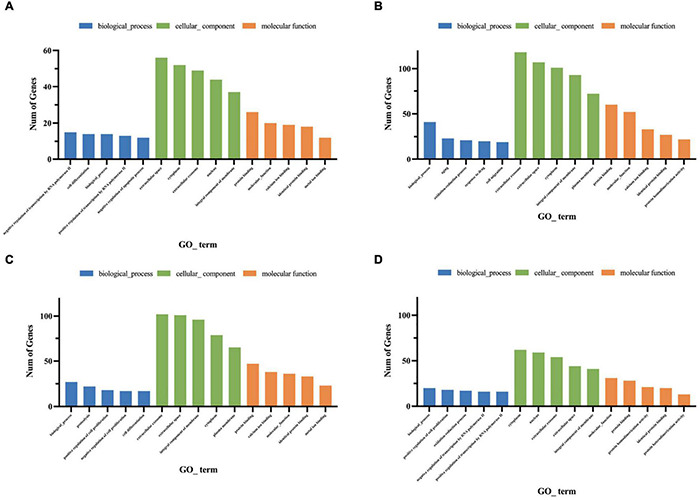
FIGURE 10.

Gene ontology enrichment analysis of genes for cluster 2 (A), cluster 7 (B), cluster 9 (C), cluster 12 (D). The Go functions include molecular functions, cellular components, and biological processes. The x-axis is the item of go function, and the ordinate represents the enriched genes by each item.
