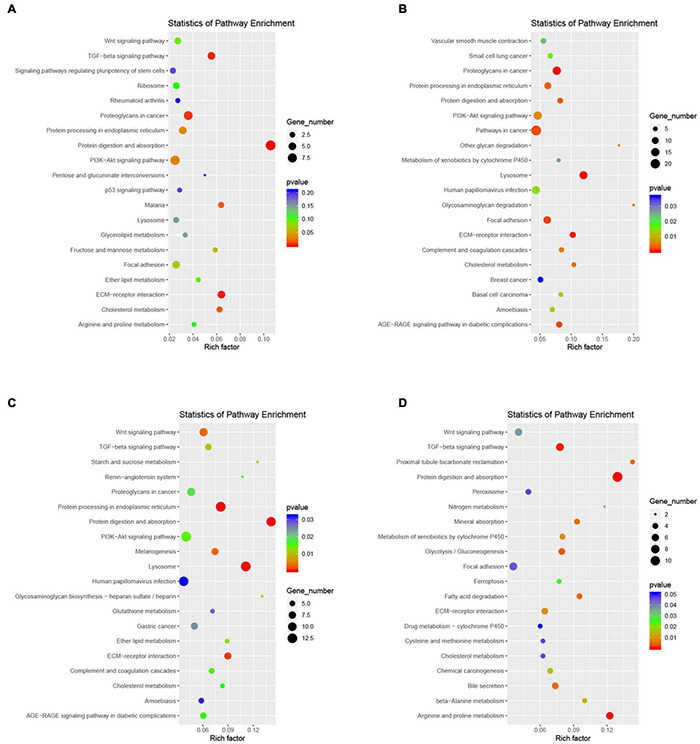
FIGURE 11.

Functional enrichment analyses using KEGG pathways for cluster 2 (A), cluster 7 (B), cluster 9 (C), cluster 12 (D). The cycle size indicates the corresponding significance values displayed as log10 (P-value). The much bigger the triangle size, the much more genes enriched in this pathway.
