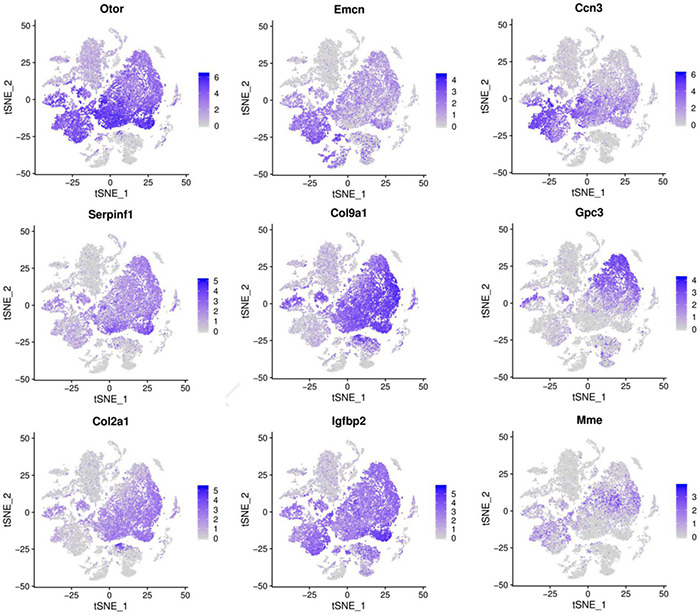
FIGURE 4.

Cells landscape of cochlea duct revealed by scRNA-seq analysis, which was performed on single-cell suspensions pooled from P1, P7, and P14. All samples were analyzed using canonical correlation analysis with the Seurat R package. Cells were clustered using a graph-based shared nearest-neighbor clustering approach plotted by tSNE plot. Feature Plots showing transcript accumulation for specific cell marker genes in individual cells of clusters 0, 2, 3, 4, 6, 7, 9, 12. Color intensity indicates the relative transcript level for the indicated gene in each cell.
