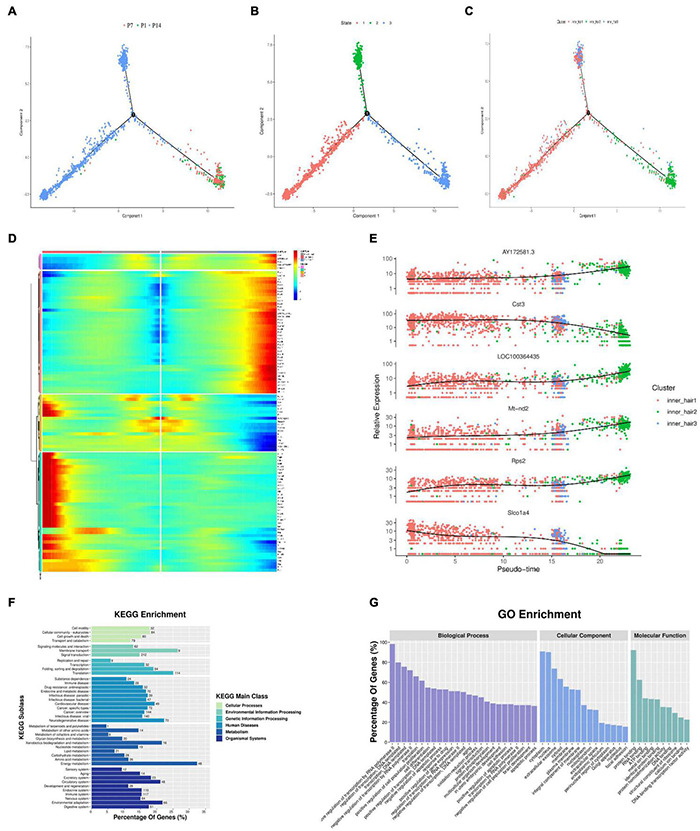
FIGURE 6.

Pseudotime trajectory of the inner hair cell. (A–C) Monocle analyses show the development of inner hair cells at different cell developmental periods (A), developmental states (B), and branches of development (C). (D) Heatmap of DEGs in different blocks along the pseudotime trajectory. The Red color represents an abundant expression of genes. (E) Dynamic gene expression with pseudotime trajectory. (F) GO enrichment analysis of genes in cells through fate 1 and fate 2. (G) Functional enrichment analyses with KEGG performed with the enriched genes in cells through fate 1 and fate 2.
