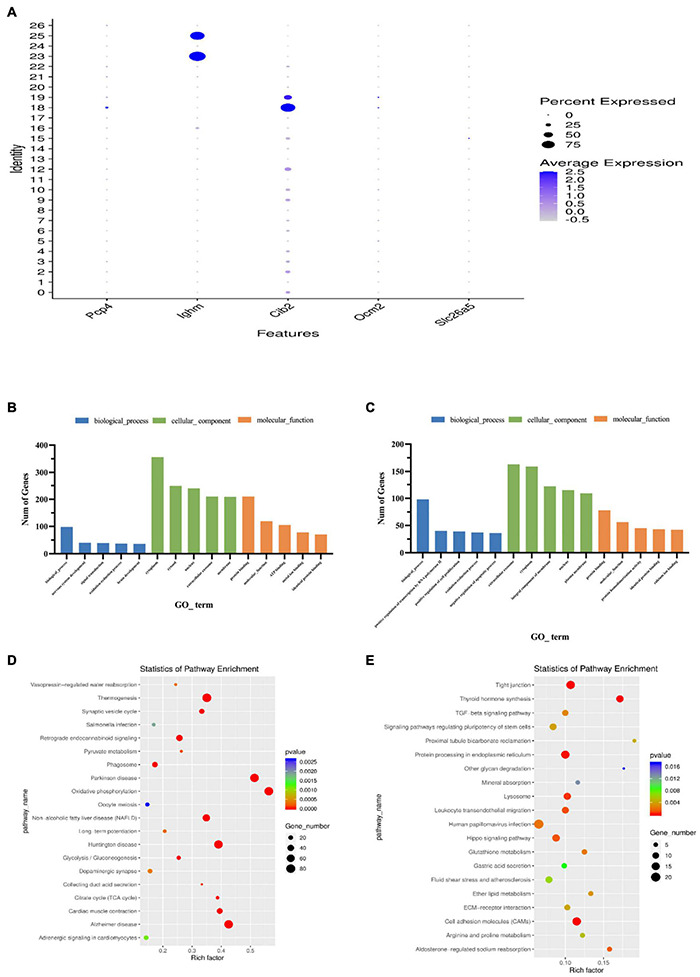
FIGURE 7.

Features of outer hair cell subtypes. (A) Accumulation of marker gene transcripts by cluster. This dot plot indicates the level of marker gene expression (dot intensity) and the fraction of cells in each cluster expressing a given marker gene (dot size). (B) GO enrichment analysis of genes for cluster 18. (C) GO enrichment analysis of genes for cluster 19. (D) Functional enrichment analyses using KEGG pathways for cluster 18. (E) Functional enrichment analyses using KEGG pathways for cluster 19. The x-axis is the item of go function, the ordinate represents the enriched genes by each item, and the cycle size indicates the significance and corresponding significance values displayed as log10 (P-value).
