. 2022 Mar 11;13(13):3837–3844. doi: 10.1039/d1sc06666h

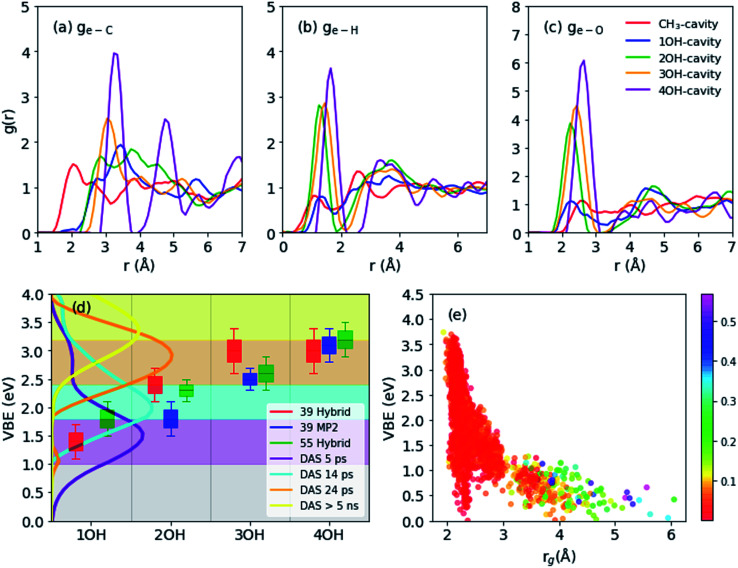
Fig. 2. (a–c) Radial distribution functions for main structures (55 molecules): electron distribution center to carbon (a), hydrogen (b), oxygen (c). (d) Vertical electron binding energies (shifted by 0.4 eV to compare with experimental results) of different cavity types as obtained from 39 molecule-system using hybrid functional (red), 39 molecules using MP2 frames (blue), and 55 molecules using hybrid functional frames (green). Decay associated spectra (DAS) calculated by global fitting of photoemission spectra with four-step sequential kinetics model. The spectra are measured by liquid methanol excited by 9.3 eV vacuum UV pulses and probed by 4.3 eV UV pulses (e) vertical binding energies vs. spin density gyration radius (55 molecules). The color map corresponds to spin density distribution anisotropy.

Fig. 2