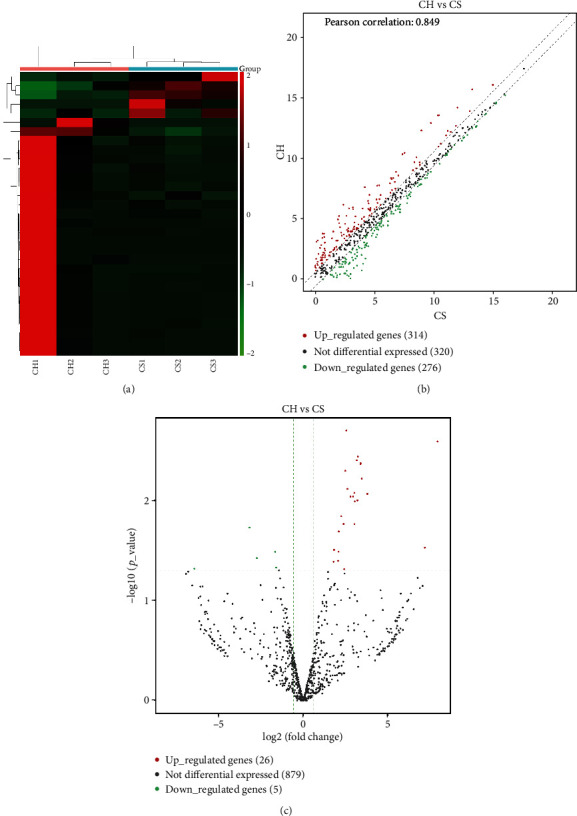
Figure 1.

Differential expression profiles of exosomal miRNAs in CH patients and CS. (a) Hierarchical clustering analysis of exosomal miRNAs between the CH patients (CH1, CH2, and CH3) and CS (CS1, CS2, and CS3). Expression values are represented by red and green shades, indicating expressions above and below the median expression level across all samples, respectively. (b) The scatter plot of 910 exosomal miRNAs. Pearson's correlation coefficient was 0.849. The red dots indicate upregulated genes, the green dots indicate downregulated genes, and the black dots indicate nondifferentially expressed genes. (c) The volcano plot of 910 exosomal miRNAs. The fold change threshold is 1.5 and P value ≤ 0.05. The red dots indicate upregulated genes, the green dots indicate downregulated genes, and the black dots indicate nondifferentially expressed genes.
